Change Backgrounds and Fonts
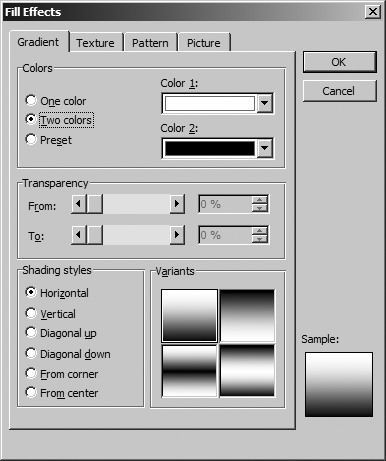
Excel provides a large set of built-in gradients and textures that provide visual interest to the chart. You can browse the gradients and fills from the Fill Effects dialog box (Figures 17-1 and 17-2). To see this dialog, right-click the chart area, select Format Chart Area, and click Fill Effects.
Use the ChartArea object to apply these gradients or textures to the background for the entire chart. Use the PlotArea object to change the background of the area where the series are plotted. Both objects provide a Fill property that returns a ChartFillFormat object you can use to apply gradients, textures, or pictures to the chart background. For example, the following code applies a gradient to the chart background:

Figure 17-1. Built-in gradients
Sub ApplyGradient( )
    Dim chrt As Chart, cf As ChartFillFormat
    ' Get the chart.
    Set chrt = ActiveChart
    ' Get the chart area fill.
    Set cf = chrt.ChartArea.Fill
    ' Make the fill visible.
    cf.Visible = True
    ' Set colors for gradient.
    cf.BackColor.SchemeColor = 17
    cf.ForeColor.SchemeColor = 1
    ' Display a gradient fill.
    cf.TwoColorGradient msoGradientDiagonalUp, 2
End Sub
And this code applies a texture to the plot area:
Sub ApplyTexture( ) Dim chrt As Chart, cf As ChartFillFormat ' Get the chart. Set chrt = ActiveChart ' Get the plot area fill. Set cf = chrt.PlotArea.Fill ' Make the fill visible. cf.Visible = ...
Get Programming Excel with VBA and .NET now with the O’Reilly learning platform.
O’Reilly members experience books, live events, courses curated by job role, and more from O’Reilly and nearly 200 top publishers.

