3Non-Regression Tests
This chapter aims to verify whether the new definitions of products, subsets or components are at least as good as the previous ones. As already noted, two cases are possible.
3.1. Non-regression on a physical quantity
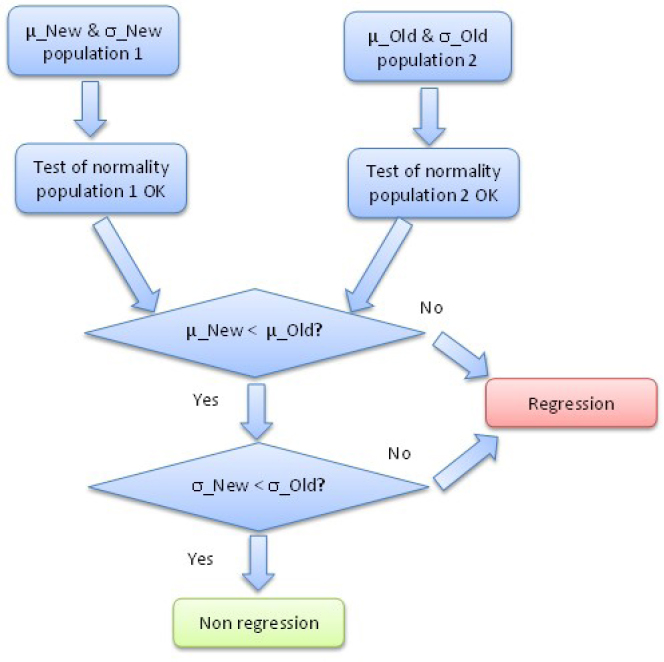
The assumption made here is that the two definitions can be modeled by normal distribution. This point must be reinforced by a test of normality. To compare two samples of observations, the classical approach involves using a central tendency measure, which is generally the mean. Therefore, a comparison of two means will be made.
The two underlying hypotheses are:

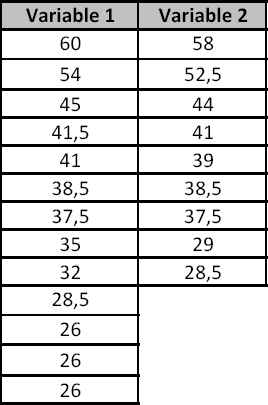
To illustrate the proposed method, let us consider the data in Table 3.1.
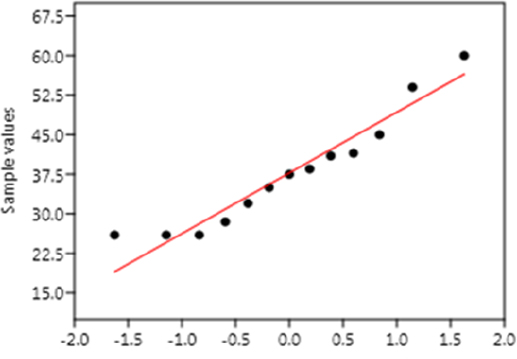
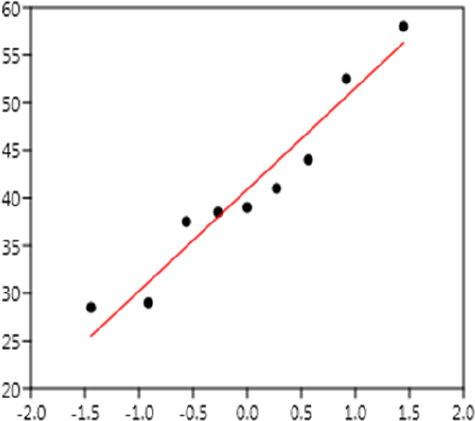
First, a test of normality should be conducted on the two variables (see Figures 3.2 and 3.3).

Figure 3.1. Overview diagram of non-regression on a physical quantity
Table 3.1. Example of a non-regression test


Figure 3.2. Test of normality on variable 1

Figure 3.3. Test of normality on variable 2
The ...
Get Product Maturity, Volume 2 now with the O’Reilly learning platform.
O’Reilly members experience books, live events, courses curated by job role, and more from O’Reilly and nearly 200 top publishers.

