Chapter 71. How to Make a Cluster Analysis
Clustering is a powerful feature released with Tableau 10 that allows you to easily group similar dimension members. This type of clustering helps you create statistically based segments that provide insight into how different groups are similar as well as how they are performing compared to each other. I’ve always leaned on segmentation as a tactic for making my analyses with Tableau more powerful, and Chapter 22 in Tableau, shares how to make a simple quadrant-based segmentation. Clustering takes this a step further by statistically grouping the objects on a view using the variables on the view.
This chapter shows you how to use the cluster feature in Tableau and how to make the generated clusters more permanent for segmentation analyses.
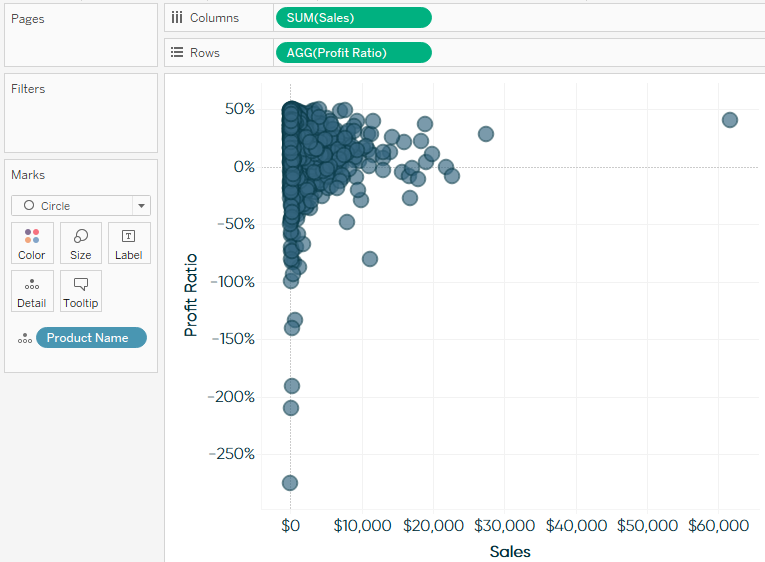
To demonstrate, I will first re-create the scatter plot just mentioned, which looks at sales and profit ratio by the Product Name dimension in the Sample – Superstore dataset:

To create quadrant-based segments, at this point I would add a reference line for average on each axis. Now with Tableau 10, we can make this segmentation much more scientific by using the Cluster feature. Cluster lives on the Analytics pane in Tableau, so to create a cluster analysis, simply navigate to the Analytics pane (toward the upper-left corner of the authoring interface) and drag “Cluster” onto the view:
A few ...
Get Practical Tableau now with the O’Reilly learning platform.
O’Reilly members experience books, live events, courses curated by job role, and more from O’Reilly and nearly 200 top publishers.

