Chapter 1. The Data Lake: A Central Repository
In the introduction, we examined how companies are beginning to recognize the value of their data. Every business with information systems essentially uses a data lake, whether it is a staging environment for a data mart or a temporary storage layer for downstream processes like loading data warehouses or delivering to core systems.
These businesses are attempting to “activate” the data—that is, put it in the hands of the business users who need it—by taking advantage of the power of data lakes to operationalize their information in a way that can grow with the company.
These users almost immediately encounter several significant problems. Different users or teams might not be using the same versions of data. This happens when a dataset—for example, quarterly sales data—is split into or distributed to different data marts or other types of system silos in different departments. The data typically is cleaned, formatted, or changed in some way to fit these different types of users. Accounts payable and marketing departments may be looking at different versions of sales results. Each department may have their unconscious assumptions and biases that cause them to use the data in different ways. And sometimes the data itself is biased, which we look at more closely in the sidebar that follows.
Companies commonly run into a “data whitespace” problem because of unstructured data. This happens when you can’t see all of your data. Traditional tools such as PostgreSQL, MySQL, and Oracle are all good for storing and querying structured data. You also have unstructured data like log files, video files, and audio files that you can’t fit into databases. You end up with data, but you can’t do anything with it. This leaves holes in your ability to “see” your business.
Enter the data lake. The idea behind a data lake is to have one place where all company data resides. This raw data—which implies an exact copy of data from whatever source it came from—is an immutable record that a business can then utilize to transform data, so that it can be used for reporting, visualization, analytics, machine learning, and business insights.
What Is a Data Lake?
A data lake is a central repository that allows you to store all your data—structured and unstructured—in volume, as shown in Figure 1-1. Data typically is stored in a raw format (i.e., as is) without first being structured. From there it can be scrubbed and optimized for the purpose at hand, be it dashboards for interactive analytics, downstream machine learning, or analytics applications. Ultimately, the data lake enables your data team to work collectively on the same information, which can be curated and secured for the right team or operation.
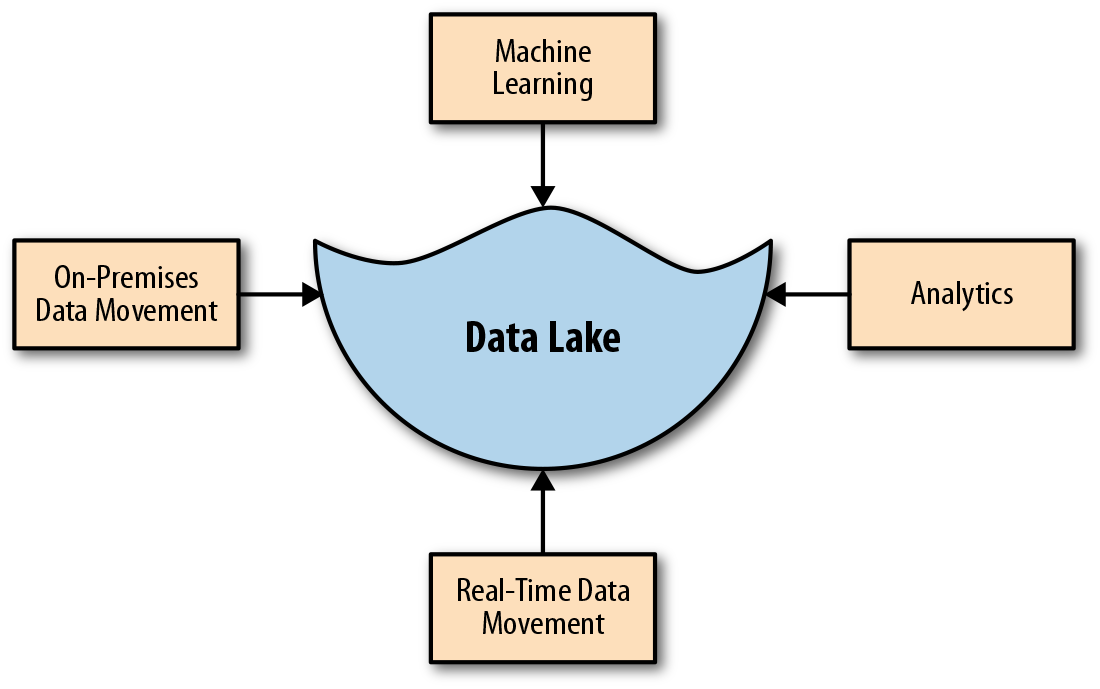
Figure 1-1. What is a data lake?
Although this book is about building data lakes in the cloud, we can also build them on-premises. However, as we delve further into the topic, you will see why it makes sense to build your data lake in the cloud. (More on that in Chapter 3.) According to Ovum ICT Enterprise Insights, 27.5% of big data workloads are currently running in the cloud.
The beauty of a data lake is that everyone is looking at and operating from the same data. Eliminating multiple sources of data and having a referenceable “golden” dataset in the data lake leads to alignment within the organization, because any other downstream repository or technology used to access intelligence in your organization will be synchronized. This is critical. With this centralized source of data, you’re not pulling bits of data from disparate silos; everyone in the organization has a single source of truth. This directly affects strategic business operations, as everyone from the C-suite on down is making important strategic decisions based upon a single, immutable, data source.
Data Lakes and the Five Vs of Big Data
The ultimate goal of putting your data in a data lake is to reduce the time it takes to move from storing raw data to retrieving actionable and valuable information. But to reach that point, you need to have an understanding of what big data is across your data team. You need to understand the “five Vs” model of big data, as shown in Figure 1-2. Otherwise, your data lake will be a mess—commonly known as a data swamp.
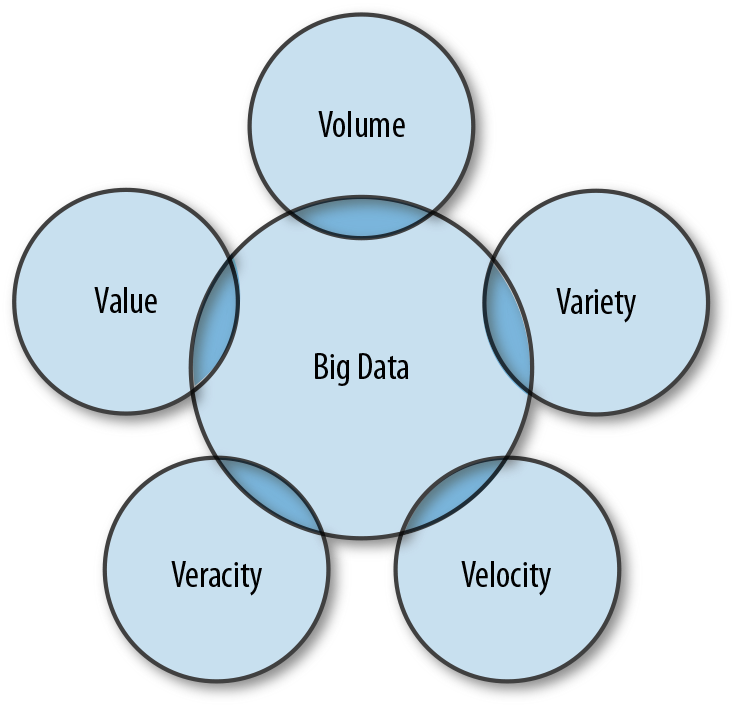
Figure 1-2. The five Vs model of big data
Big data, by definition, describes three different types of data: structured, semi-structured, and unstructured. The complexity of the resulting data infrastructure requires powerful management and technological solutions to get value out of it.
Most data scientists define big data as having three key characteristics: volume, velocity, and variety. More recently, they’ve added two other qualities: veracity and value. Let’s explore each in turn:
- Volume
-
Big data is big; this is its most obvious characteristic. Every second, almost inconceivable amounts of data are generated from financial transactions, ecommerce transactions, social media, phones, cars, credit cards, sensors, video, and more. The data has in fact become so vast that we can’t store or process it using traditional databases. Instead, we need distributed systems in which data is stored across many different machines—either physical (real) or virtual—and managed as a whole by software. IDC predicts that the “global datasphere” will grow from 33 zettabytes (ZB) in 2018 to 175 ZB by 2025. One ZB is approximately equal to a thousand exabytes, a billion terabytes, or a trillion gigabytes. Visualize this: if each terabyte were a kilometer, a ZB would be equivalent to 1,300 round trips to the moon.
- Velocity
-
Next, there’s the velocity, or speed, of big data. Not only is the volume huge, but the rate at which it is generated is blindingly fast. Every minute, the Weather Channel receives 18 million forecast requests, YouTube users watch 4.1 million videos, Google delivers results for 3.6 million searches, and Wikipedia users publish 600 new edits. And that’s just the tip of the iceberg. Not only must this data be analyzed, but access to the data must also be instantaneous to allow for applications like real-time access to websites, credit card verifications, and instant messaging. As it has matured, big data technology has allowed us to analyze extremely fast data even as it is generated, even without storing it in a database.
- Variety
-
Big data is made up of many different types of data. No longer having the luxury of working with structured data that fits cleanly into databases, spreadsheets, or tables, today’s data teams work with semi-structured data such as XML, open-standing JSON, or NoSQL; or they must contend with completely unstructured data such as emails, texts, and human-generated documents such as word processing or presentation documents, photos, videos, and social media updates. Most—approximately 85%—of today’s data is unstructured. Previously, this data was not considered usable. But modern big data technologies have enabled all three types of data to be generated, stored, analyzed, and consumed simultaneously, as illustrated in Figure 1-3.
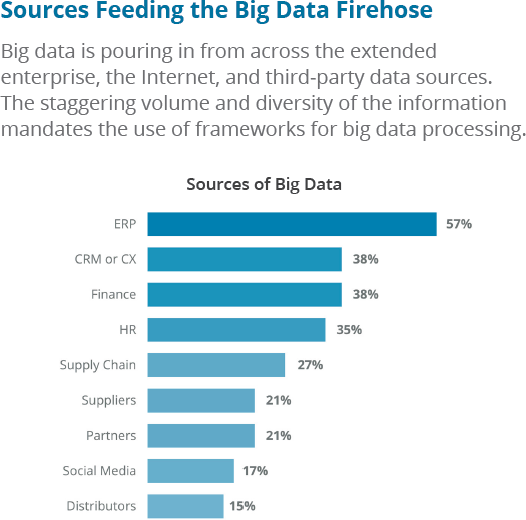
Figure 1-3. The variety of sources in big data deployments
- Veracity
-
Veracity, the quality of the data, is a recent addition to the original three attributes of the big data definition. How accurate is your data? Can you trust it? If not, analyzing large volumes of data is not only a meaningless exercise, but alsoa dangerous one given that inaccurate data can lead to wrong conclusions.
- Value
-
Finally, there’s the big question: what is the data worth? Generating or collecting massive volumes of data is, again, pointless if you cannot transform it into something of value. This is where financial governance of big data comes in. Researchers have found a clear link between data, insights, and profitability, but businesses still need to be able to calculate the relative costs and benefits of collecting, storing, analyzing, and retrieving the data to make sure that it can ultimately be monetized in some way.
Data Lake Consumers and Operators
Big data stakeholders can be loosely categorized as either operators or consumers. The consumer category can be further divided into internal and external users. (We provide more granular definitions of roles in the following section.) Both camps have different roles and responsibilities in interacting with each of the five Vs.
Operators
Data operators include data engineers, data architects, and data and infrastructure administrators. They are responsible for dealing with the volume, velocity, variety, and veracity of the data. Thus they must ensure that large amounts of information, no matter the speed, arrive at the correct data stores and processes on time. They’re responsible for ensuring that the data is clean and uncorrupted. In addition, the operators define and enforce access policies—policies that determine who has access to what data.
Indeed, ensuring veracity is probably the biggest challenge for operators. If you can’t trust the data, the source of the data, or the processes you are using to identify which data is important, you have a veracity problem. These errors can be caused by user entry errors, redundancy, corruption, and myriad other factors. And one serious problem with big data is that errors tend to snowball and become worse over time. This is why an operator’s primary responsibility is to catalog data to ensure the information is well governed but still accessible to the right users.
In many on-premises data lakes, operators end up being the bottlenecks. After all, they’re the ones who must provision the infrastructure, ingest the data, ensure that the correct governance processes are in place, and otherwise make sure the foundational infrastructure and data engineering is robust. This can be a challenge, and resources are often limited. Rarely is there is enough compute, memory, storage—or even people—to adequately meet demand.
But in the cloud, with the scalability, elasticity, and tools that it offers, operators have a much easier time managing and operationalizing a data lake. They can allocate a budget and encourage consumers to figure things out for themselves. That’s because after a company has placed the data in the data lake (the source of truth) and created a platform that can easily acquire resources (compute), project leaders can more effectively allocate a budget for the project. After the budget is allocated, the teams are now empowered to decide on and get the resources themselves and do the work within the given project timeframe.
Consumers (Both Internal and External)
Consumers are the data scientists and data analysts, employee citizen scientists, managers, and executives, as well as external field workers or even customers who are responsible for drawing conclusions about what’s in the data. They are responsible for finding the value, the fifth V, in it. They also must deal with the volume of data when it comes to the amount of information that they need to sift through as well as the frequency of requests they get for ad hoc reports and answers to specific queries. These teams are often also working with a variety of unstructured and structured datasets to create more usable information. They are the ones who analyze the data produced by the operators to create valuable and actionable insights. The consumers use the infrastructure managed by the operators to do these analyses.
There are internal and external users of the data lake. Internal users are those developing tools and recommendations for use within your company. External users are outside your company; they want limited access to data residing in the data lake. Google AdSense is an example of this: Google is developing tools and insights for its internal use at a global level. At the same time, it is developing portals for external entities to gain insights into their advertising companies. If I’m the Coca-Cola Company, for instance, I would want to know the success rate of my ads targeting Pepsi users, and whether I can use my advertising dollars better.
Challenges in Operationalizing Data Lakes
In 2017, Gartner estimated that perhaps 60% of all big data projects fail. That sounds grim; but the reality is worse. According to a Twitter post by Gartner analyst Nick Heudecker, Gartner was “too conservative” with this estimate. Heudecker in 2018 estimated that the real failure rate was “closer to 85%.” But the problem wasn’t a technical one; it was because of the humans—the operators and consumers—who were necessarily involved in the process.
McKinsey came to the same pessimistic conclusion. Though research done by the McKinsey Global Institute (a sister organization) generated a lot of excitement by predicting that retailers using big data and analytics could improve their operating margins by more than 60%, when McKinsey recently gathered analytics leaders from leading large enterprises and asked about the revenue or cost benefits they’d received from big data, 75% said it had been less than 1%. Why was this?
Here are the three most common reasons why big data projects fail:
- Shortage of resources and expertise
-
Data science jobs are already difficult to fill, and according to The Quant Crunch report, demand is expected to rise 28% by 2020. Businesses eager to begin big data projects are often frustrated by the lack of data science skills in their talent pool, as depicted in Figure 1-4, and mistakes made by relative newbies to big data can cause major setbacks.
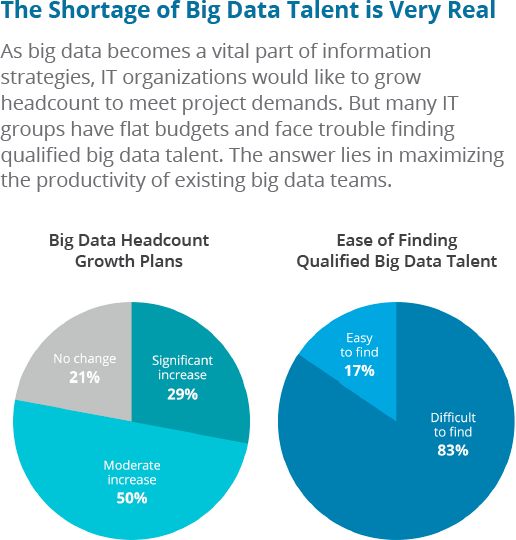
Figure 1-4. Shortage of big data talent is very real
- Costs are too high
-
Talent is not only scarce, it’s expensive. And many businesses are dependent on third-party consulting firms to successfully complete projects, which adds to the cost.
-
In addition, data lakes consume a lot of infrastructure (compute and storage). If proper financial governance is not put in place, companies risk incurring runaway infrastructure costs with no visibility on their ROI.
-
At least part of the problem is that organizations don’t provide sufficient resources to their big data projects. According to a Qubole survey, a full 75% of companies identified a gap between their big data resources and the potential value of the project(s), as shown in Figure 1-5.
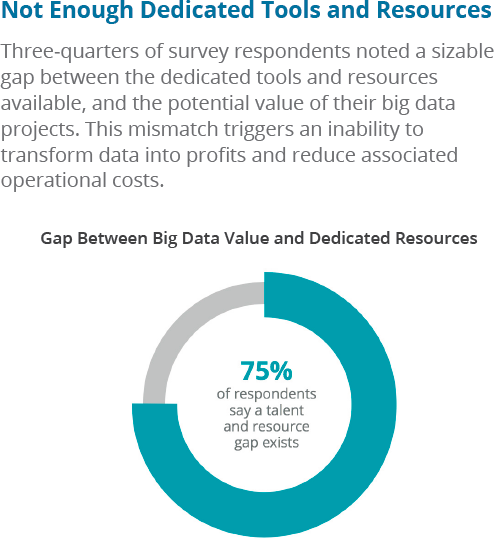
Figure 1-5. The gap between big data needs and resources
Cloud-native platforms like Qubole intelligently optimize resources, as demonstrated in Figure 1-6. They automatically assign more capacity when needed and release resources when workloads require less capacity by doing intelligent workload-aware autoscaling. This is a huge game changer for organizations that pay only for what they use rather than preemptively ordering capacity and hiring teams to provision and maintain that technology.
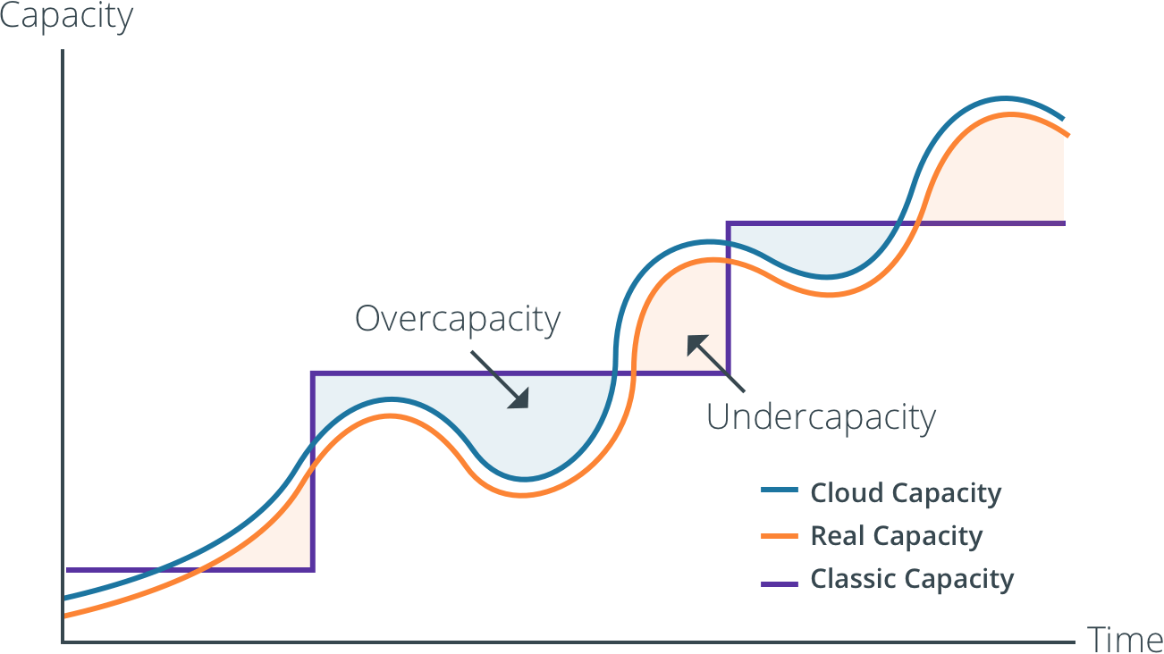
Figure 1-6. How cloud-native big data platforms can intelligently optimize resources
- It takes too long to realize value
-
Because of the relative newness of the technologies, coupled with the difficulty of finding expertise, many big data projects fail to deliver within expected timeframes, as shown in Figure 1-7.
Given these challenges, should companies build a solution or buy one? This question of “build or buy” inevitably comes up in a big data project. It’s important to not conflate technical and business issues when making this decision. When faced with a technical challenge, don’t hesitate: buy your way out of it. If someone has already created a solution, purchase it.
What we’ve seen is that most do-it-yourself projects return less-than-expected value because the teams spend most (75%) of the allocated time simply acquiring sufficient resources. This leaves less than 25% of the project time to realize value from the data. Now imagine a project timeline for which technology resources can be acquired in minutes, leaving more than 90% of the project timeframe to find and acquire data. Being able to easily spin up an engine provides faster iteration, and you’ll get answers to queries in seconds versus minutes. Having the right platform and engine in a matter of minutes means that projects are better positioned to find significant value from data in less time.
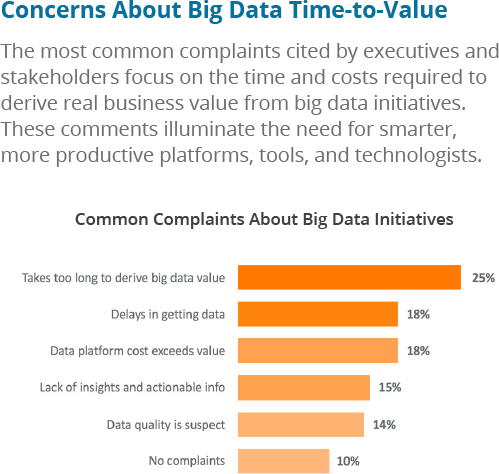
Figure 1-7. Concerns about big data time to value
The SaaS model also provides advantages over licensed distributions for which you buy software by the node for a yearly license, because the latter method is too fixed and outdated to keep up with data growth or the speed of innovation.
Get Operationalizing the Data Lake now with the O’Reilly learning platform.
O’Reilly members experience books, live events, courses curated by job role, and more from O’Reilly and nearly 200 top publishers.

