Chapter 10. Visualizing Your Data
Chapter at a Glance
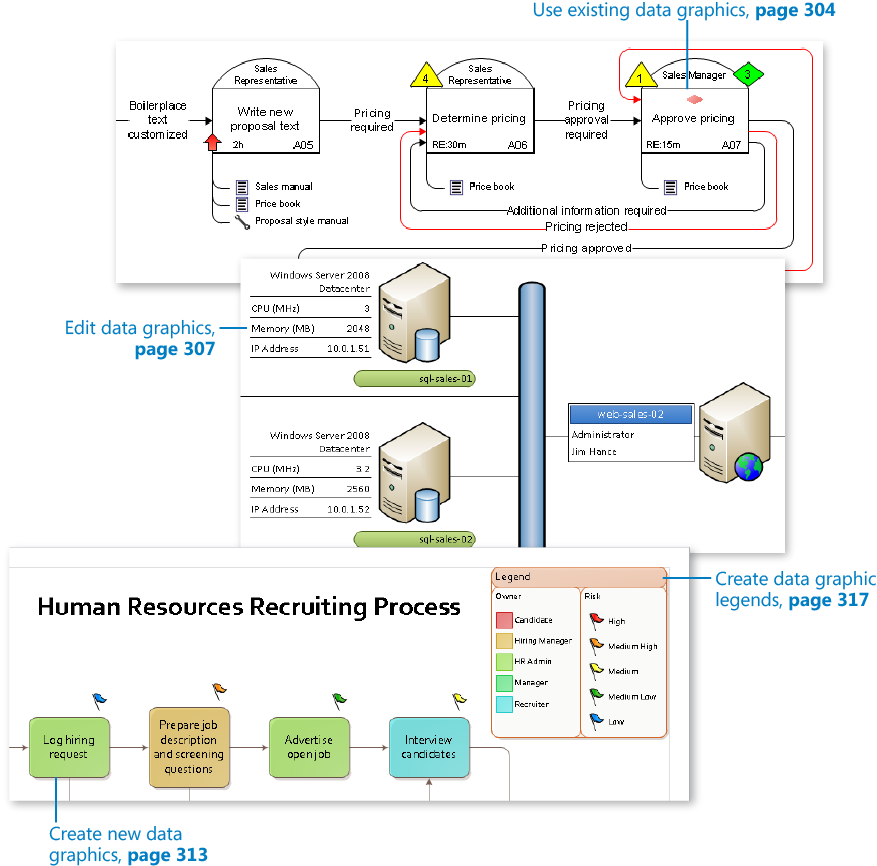
In this chapter, you will learn how to | |
✓ | Enhance diagrams with data-driven graphics. |
✓ | Use existing data graphics. |
✓ | Edit data graphics. |
✓ | Create new data graphics. |
✓ | Create data graphic legends. |
In Chapter 6, you learned how to enter data into Microsoft Visio shapes and how to integrate data from external sources into your diagrams. After you have data in your Visio diagram, you need techniques to make that data visible. With a Visio data graphic, you can do just that by displaying text or a graphic on a Visio shape based on the data inside the shape.
Data graphics are even more powerful when a diagram ...
Get Microsoft® Visio® 2010: Step by Step now with the O’Reilly learning platform.
O’Reilly members experience books, live events, courses curated by job role, and more from O’Reilly and nearly 200 top publishers.

