Here is the explanation of the code:
- plt.figure(figsize=(6,4)) sets the figure size to 6 x 4.
- plt.hist(nd) plots the histogram.
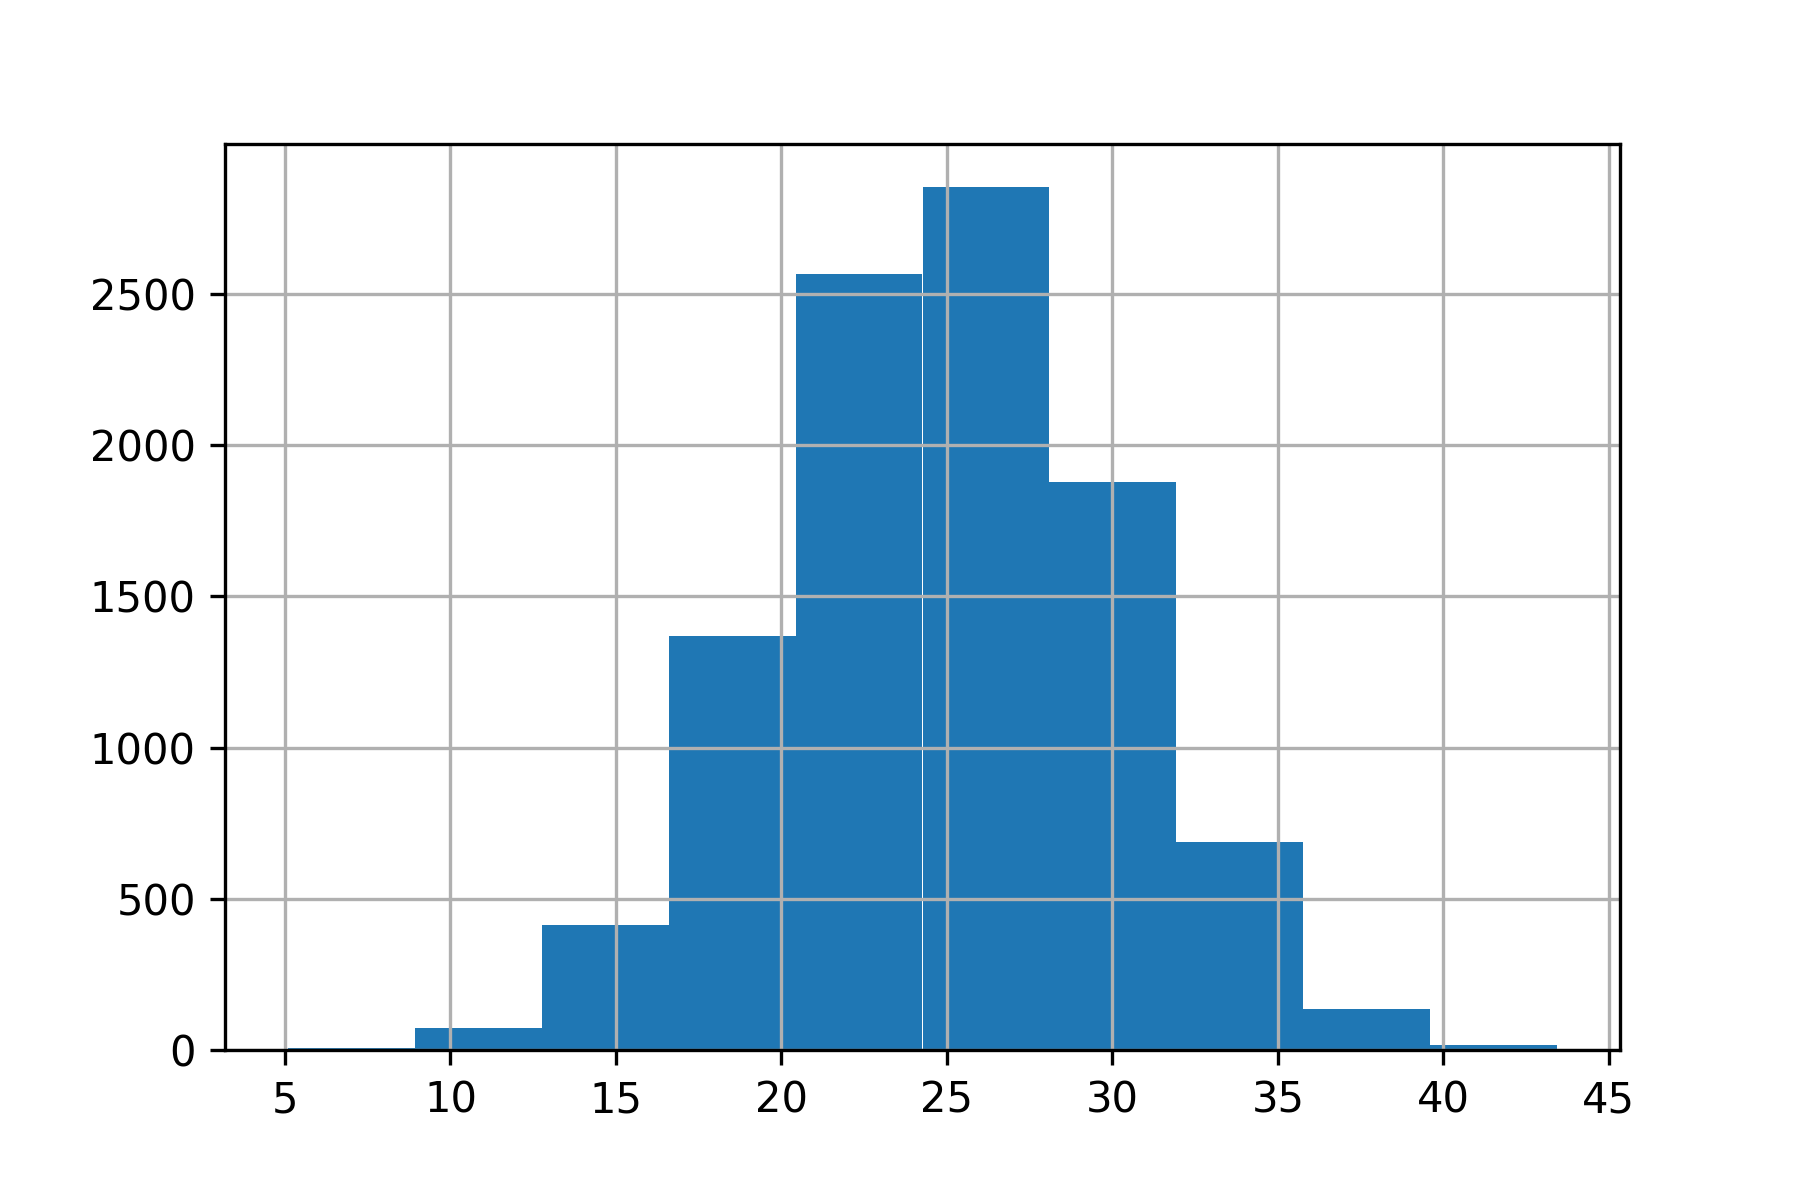
- Since we are using dpi=300, it will create the image of the figure with 1,800 x 1,200 pixels (6*300 x 4*300).
The figure saved in histogram_300.png looks as follows:

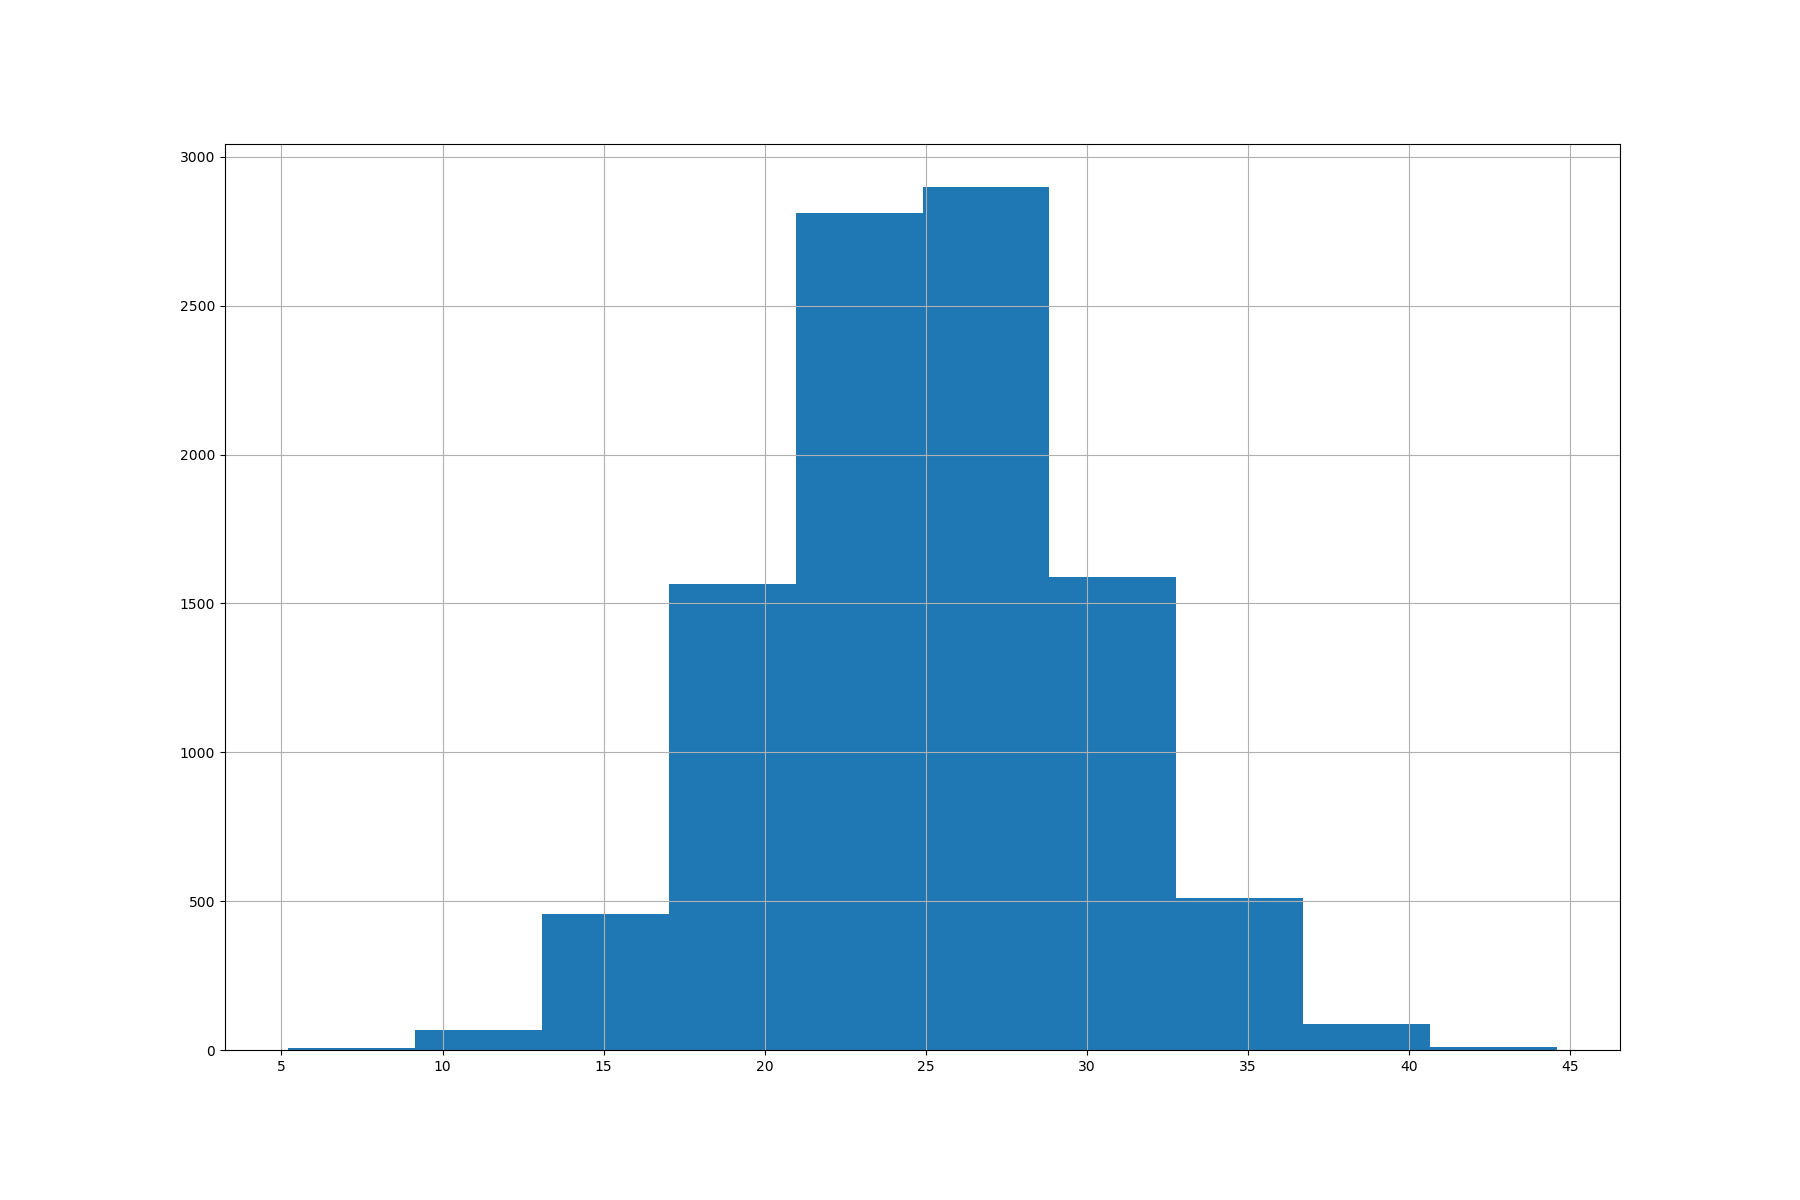
If this same figure of 1800 x 1200 pixels has to be printed at 100 DPI, we need the figure size of 18 x 12. We again save the figure with the 18 x 12 size and dpi=100. This is how the saved output looks:

It should be noted that ticklabels ...

