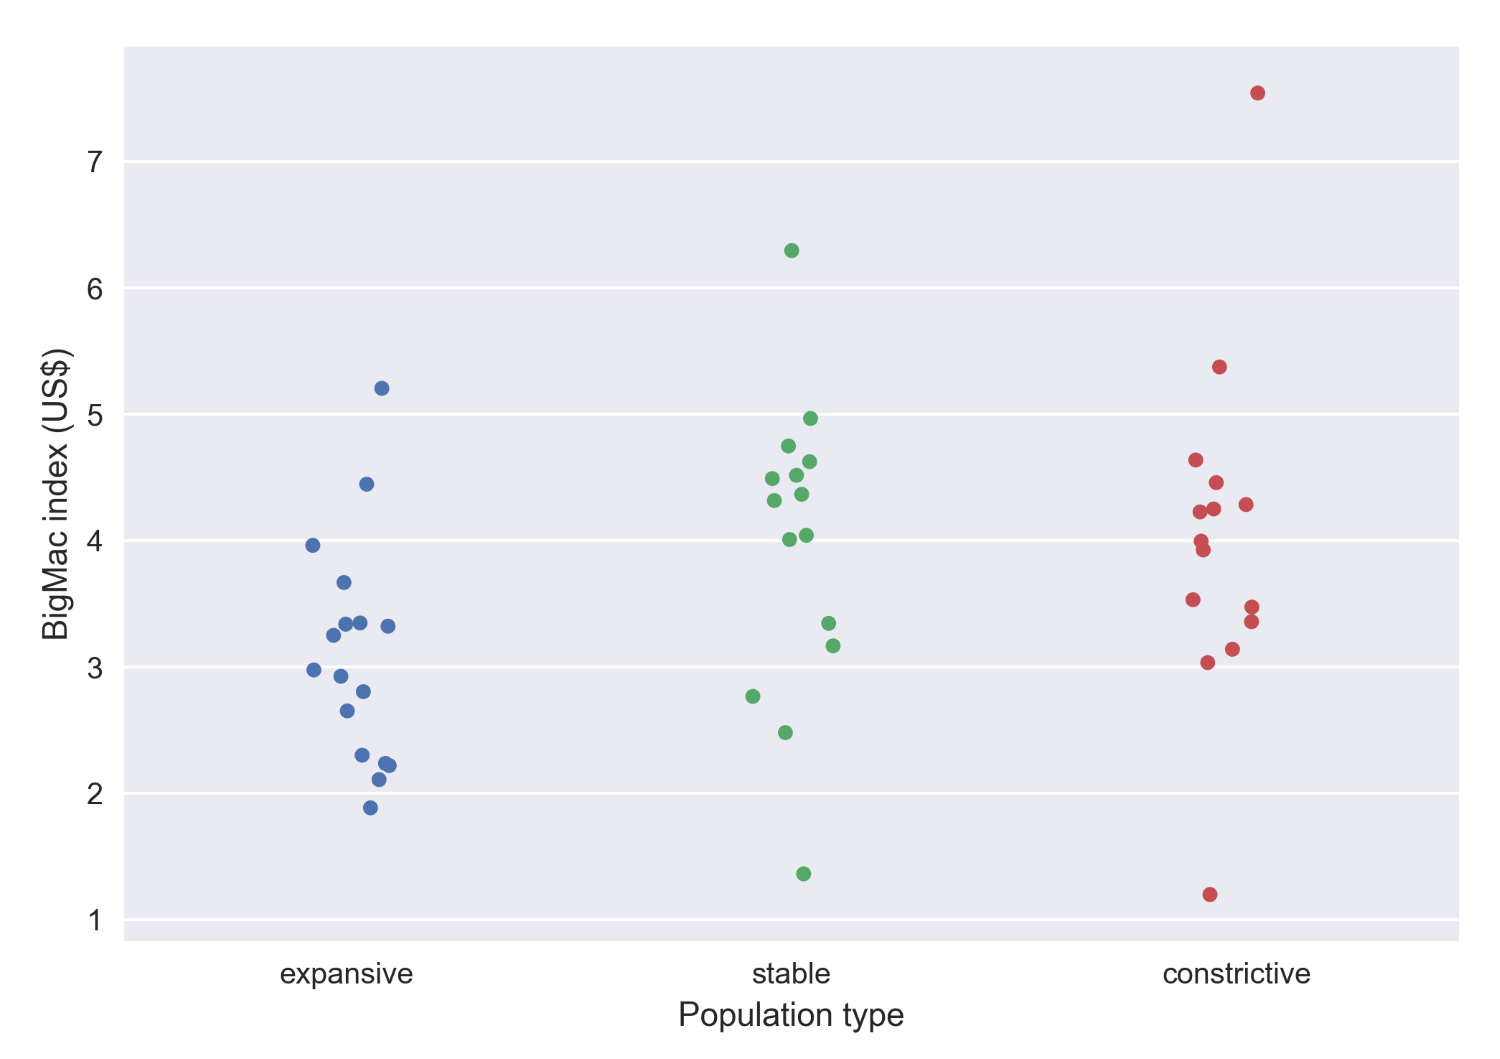
A strip is basically a scatter plot where the x axis represents a categorical variable. Typical uses of a strip plot involves applying a small random jitter value to each data point such that the separation between points becomes clearer:
# Strip plot with jitter valueax = sns.stripplot(x="population type", y="dollar_price", data=merged_df2, jitter=True)ax.set_xlabel("Population type")ax.set_ylabel("BigMac index (US$)")plt.show()
A swarm plot is very similar to a strip plot, yet the locations of points are adjusted automatically to avoid overlap even if the jitter value is not applied. These plots resemble bees swarming ...

