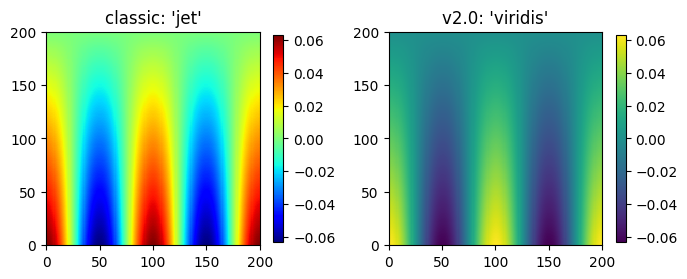
Colormaps are useful in showing gradient. The yellow to blue "viridis" colormap is now the default one in Matplotlib 2.0. This perceptually uniform colormap better represents the transition of numerical values visually than the classic “jet” scheme. This is a comparison between two colormaps:

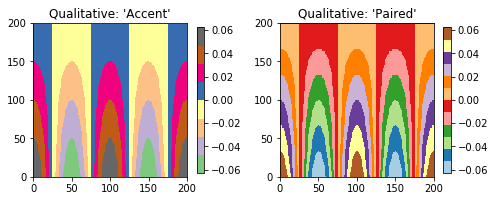
Besides defaulting to a perceptually continuous colormap, qualitative colormaps are now available for grouping values into categories:


