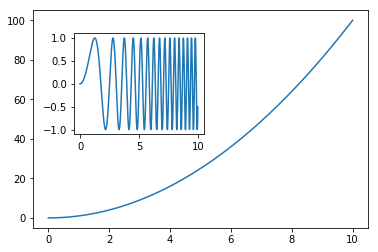
We can draw an inset plot by calling figure.add_axes(). The dimension can be set by these parameters--[left, bottom, width, height]:
import matplotlib.pyplot as pltimport numpy as npx = np.linspace(0,10,1000)y2 = np.sin(x**2)y1 = x**2# Initiate a figure with subplot axesfig, ax1 = plt.subplots()# Set the inset plot dimensionsleft, bottom, width, height = [0.22, 0.45, 0.3, 0.35]ax2 = fig.add_axes([left, bottom, width, height])# Draw the plotsax1.plot(x,y1)ax2.plot(x,y2)# Show the figureplt.show()


