Now, let's go to Statistics | I/O Graph:
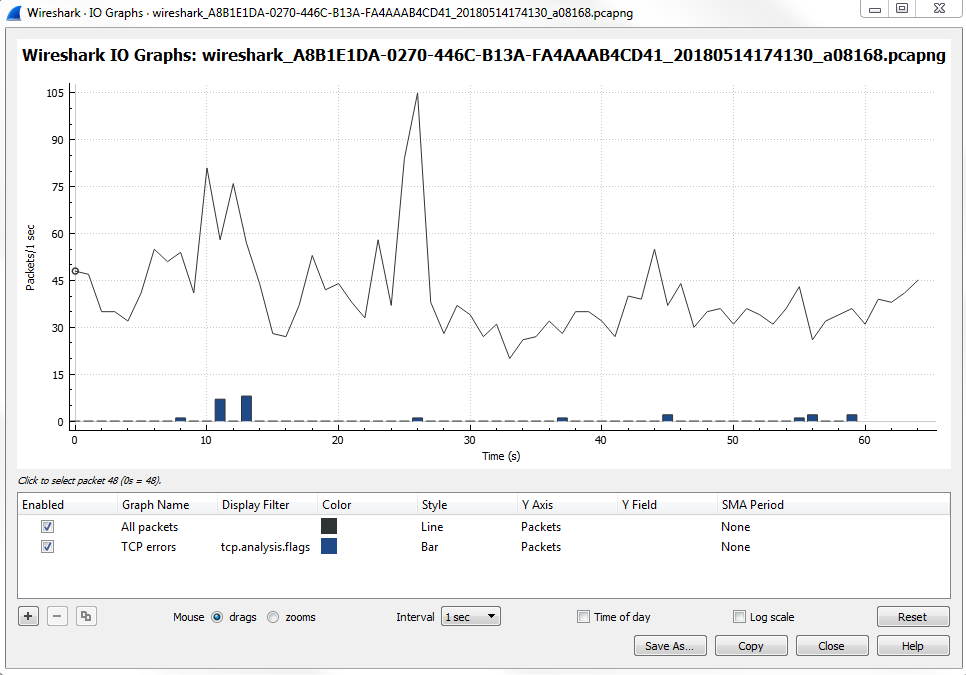
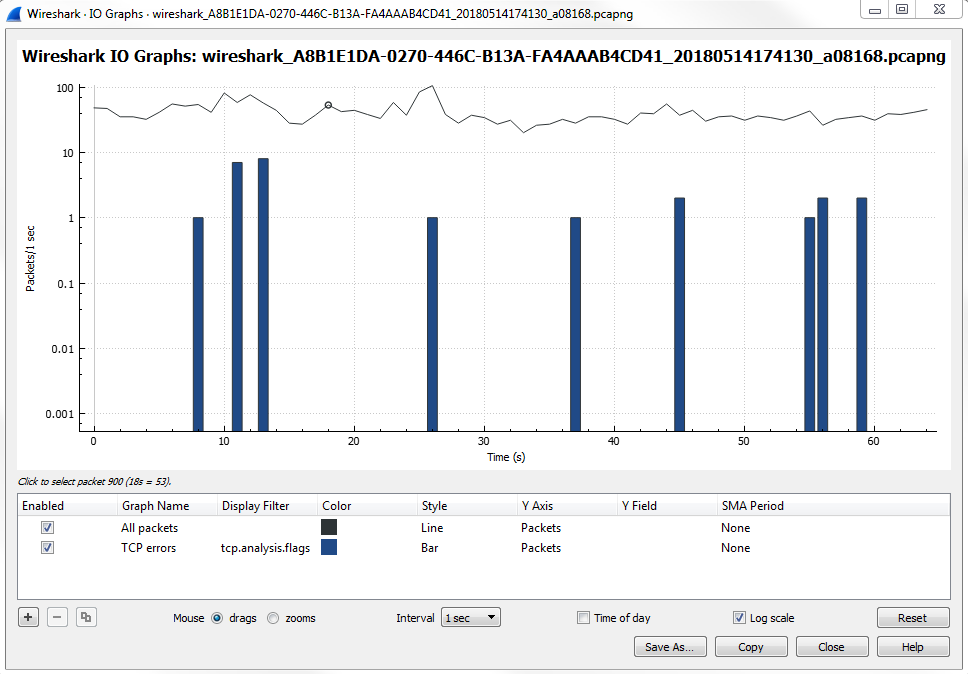
The I/O graph is a very powerful feature in Wireshark, and here it's showing us all the packets per second, and all of this is customizable. You can change the Interval and you can also change whether it's a linear or logarithmic scale:
Depending on the needs of the packet capture that you're looking at, maybe there are very drastic differences between some different streams that you're wanting to graph, or maybe some differences between the filters that we want to apply because you can layer ...

