Visual Studio provides a straightforward way to manage all your breakpoints under a single toolbox window, which you can find by navigating to Debug | Windows | Breakpoints (keyboard shortcut: Ctrl + D + B). When you place multiple breakpoints in your code file or solution, this window helps you to navigate between them very easily.
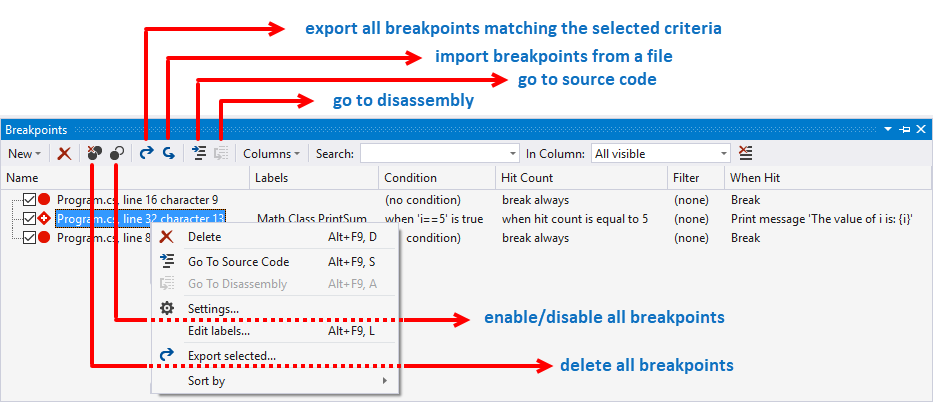
You can add a new breakpoint, delete a breakpoint, or enable/disable it from here. This also lists the label, conditions, hit counter, filter, complete function name, process, and many other details set to each breakpoint, and is easily searchable: