Chapter 6. Dashboards
Dashboards in Salesforce provide a powerful way to visualize data stored within your system. Whether you’re an entry-level salesperson, a midlevel support manager with a team of direct reports, or a senior executive at a nonprofit organization, you can leverage dashboards to better understand your data and make decisions. It is common for system administrators or other users with the appropriate permissions to create custom dashboards showing charts, tables, and metrics in support of the various roles within an organization.
For example, your company’s VP of Sales might log in to Salesforce and immediately see a dashboard embedded into their homepage showing key sales figures. They can use this information to gauge whether their team is on track to hit their goals. Their sales managers might each have a dashboard with charts and tables showing their team’s performance. Those managers might also use another dashboard to meet with their individual sales team members to coach them on their deals. Figure 6-1 shows an example of a dashboard for an individual sales rep to see their leads and sales pipeline. They can use this to quickly determine their performance and what information they are communicating to their superiors.
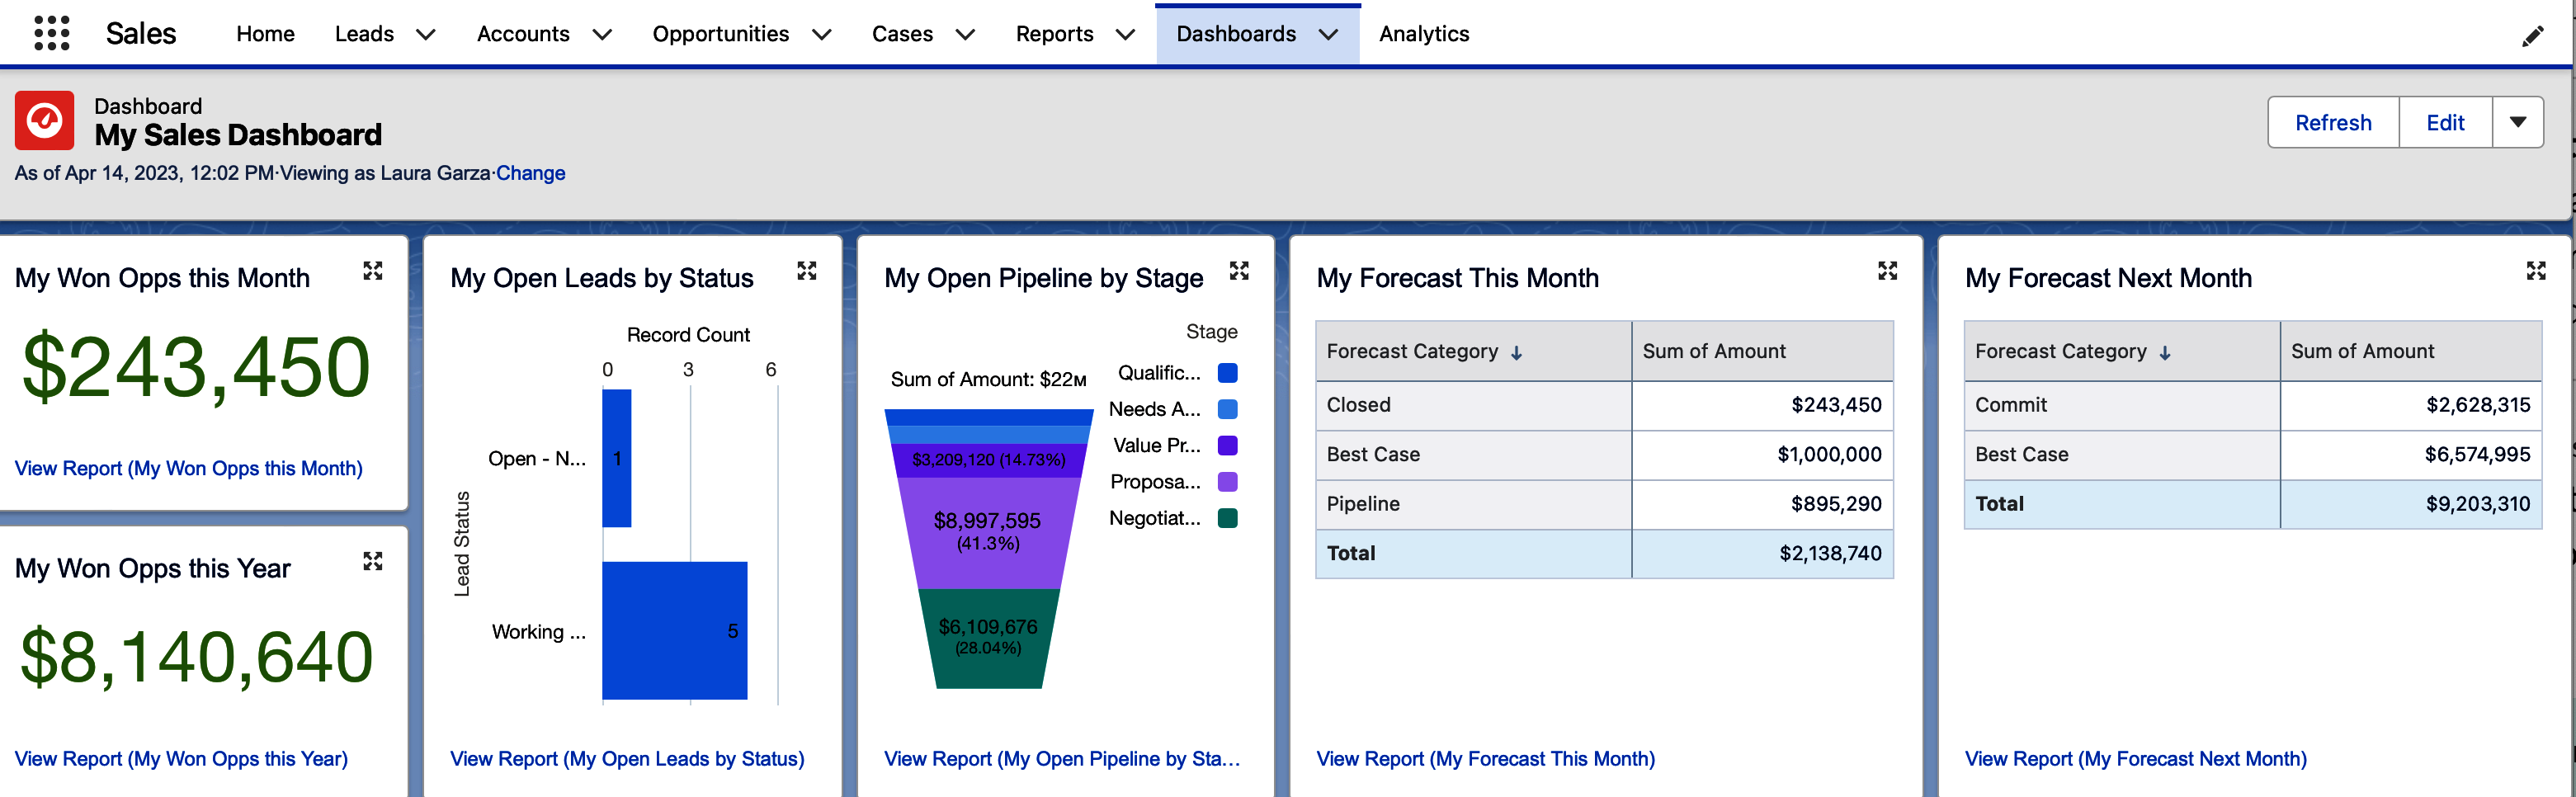
Figure 6-1. Sales rep dashboard
In this chapter, you’ll step through dashboard features and explore the Dashboards tab. You’ll learn how ...
Get Mastering Salesforce Reports and Dashboards now with the O’Reilly learning platform.
O’Reilly members experience books, live events, courses curated by job role, and more from O’Reilly and nearly 200 top publishers.

