REPORTING RISK MANAGEMENT KRI DATA
Indicators for a number of key risks relating to a single department or a firm are commonly reported on dashboards, an example of which is given in Figure 7.7.
Figure 7.7 KRI dashboard example
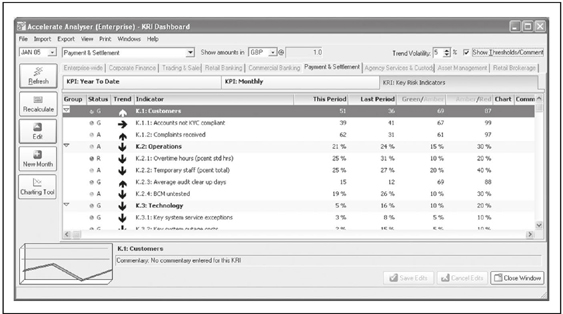
As can be seen, a Red (R)/Amber (A)/Green (G) status column is very common together with a trend indicator. These two columns provide a quick view and guide the dashboard user as to which indicators to focus on first. It is also common to record the most recent three, six or twelve periods and to have an average of the most recent three in order to smooth the volatilities in the indicators.
In Figure 7.7, the ‘Overtime ...
Get Mastering Risk Management now with the O’Reilly learning platform.
O’Reilly members experience books, live events, courses curated by job role, and more from O’Reilly and nearly 200 top publishers.

