Grafana runs in its own container and serves a sophisticated dashboard that works well with InfluxDB as a data source. To locate the port, type the following command:
k describe service monitoring-influxdb --namespace=kube-system | grep NodePort

Type:                NodePort
NodePort:            <unset> 30763/TCP
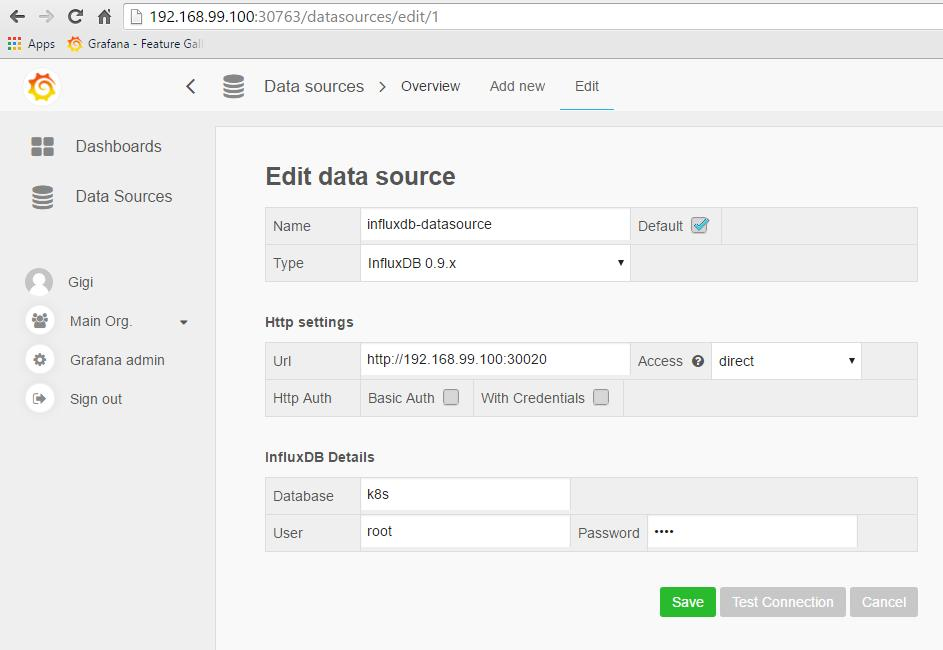
Now, you can access the Grafana web interface on that port. The first thing you need to do is set up the data source to point to the InfluxDB backend:

Make sure to test the connection and then go explore the various options in the dashboards. There are several default dashboards, but you should be able to customize them to your preferences. ...

