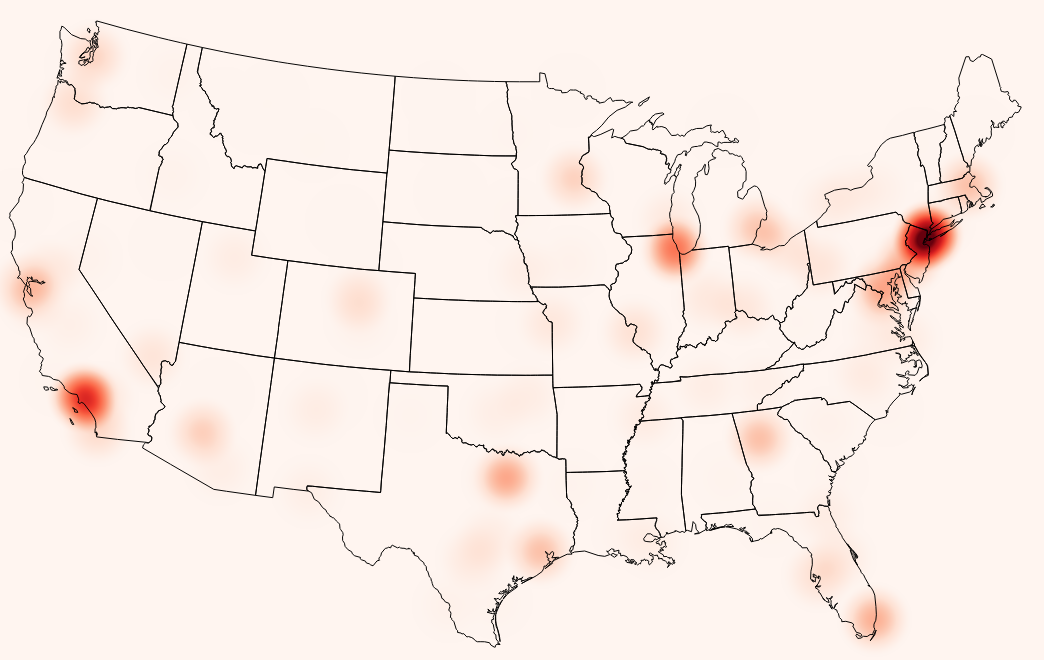
A heatmap represents the spatial density of points that are visualized across a color ramp. The heatmap vector style can only be applied to point or multipoint vector geometry types.
As an example, the following screenshot uses a heatmap on a city population point layer to visualize the density and distribution of population in the United States of America:

To create a heatmap, open the style properties of a point vector file and select Heatmap as the renderer. The heatmap vector renderer has five settings (as shown in following screenshot) that determine how the heatmap will display:
Color ramp sets the color ramp ...

