Using the bell curve in performance evaluation
Many organizations prefer to fit the performance ratings distribution into a bell curve.
What's a bell curve?
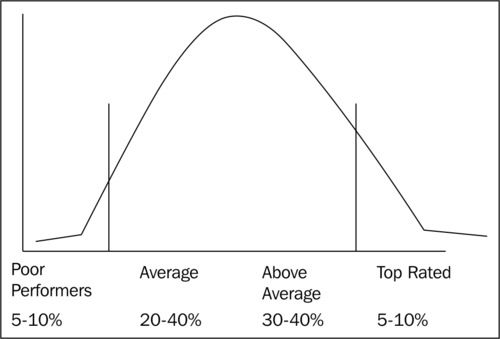
The bell curve represents the normal distribution in statistics. Performance ratings fitted into a bell curve looks as follows:

The normal distribution implies that when considering a large number of data points, most values will tend towards the average and a small percentage of very high and very low numbers. For example, if you conduct a poll of people to capture their physical fitness, you might find a large number of people will be averagely fit, while some will be very fit, and some will ...
Get Management in India now with the O’Reilly learning platform.
O’Reilly members experience books, live events, courses curated by job role, and more from O’Reilly and nearly 200 top publishers.

