A learning curve is a plot that compares how the training accuracy scores and the test accuracy scores vary as the number of samples/rows added to the data increases. In order to construct the learning curve for the k-nearest neighbors model, we use the following code:
skplt.estimators.plot_learning_curve(knn_classifier, features, target)plt.show()
This results in the following plot:
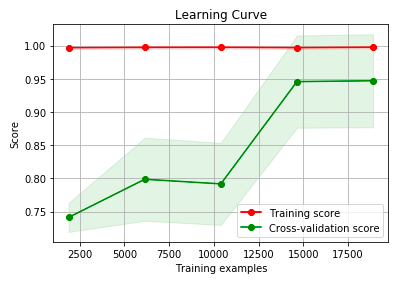
Learning curve for the K-NN model
In the preceding curve, the following applies:
- The training score and the test score are only the highest when the number of samples is 15,000. This suggests that even if we had only 15,000 samples (instead of ...

