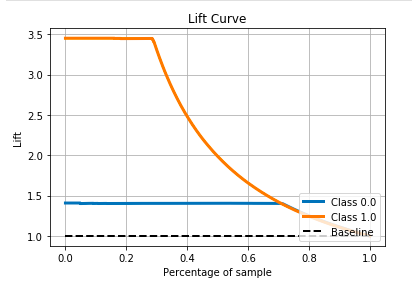
A lift curve gives you information about how well you can make predictions by using a machine learning model, as opposed to when you are not using one. In order to construct a lift curve for the k-nearest neighbor model, we use the following code:
# Lift curve for the K-NN modeltarget_prob = knn_classifier.predict_proba(X_test)skplt.metrics.plot_lift_curve(y_test, target_prob)plt.show()
This results in the following plot:

How do we interpret the preceding lift curve? We have to look for the point at which the curve dips. This is illustrated for you in the following diagram:

