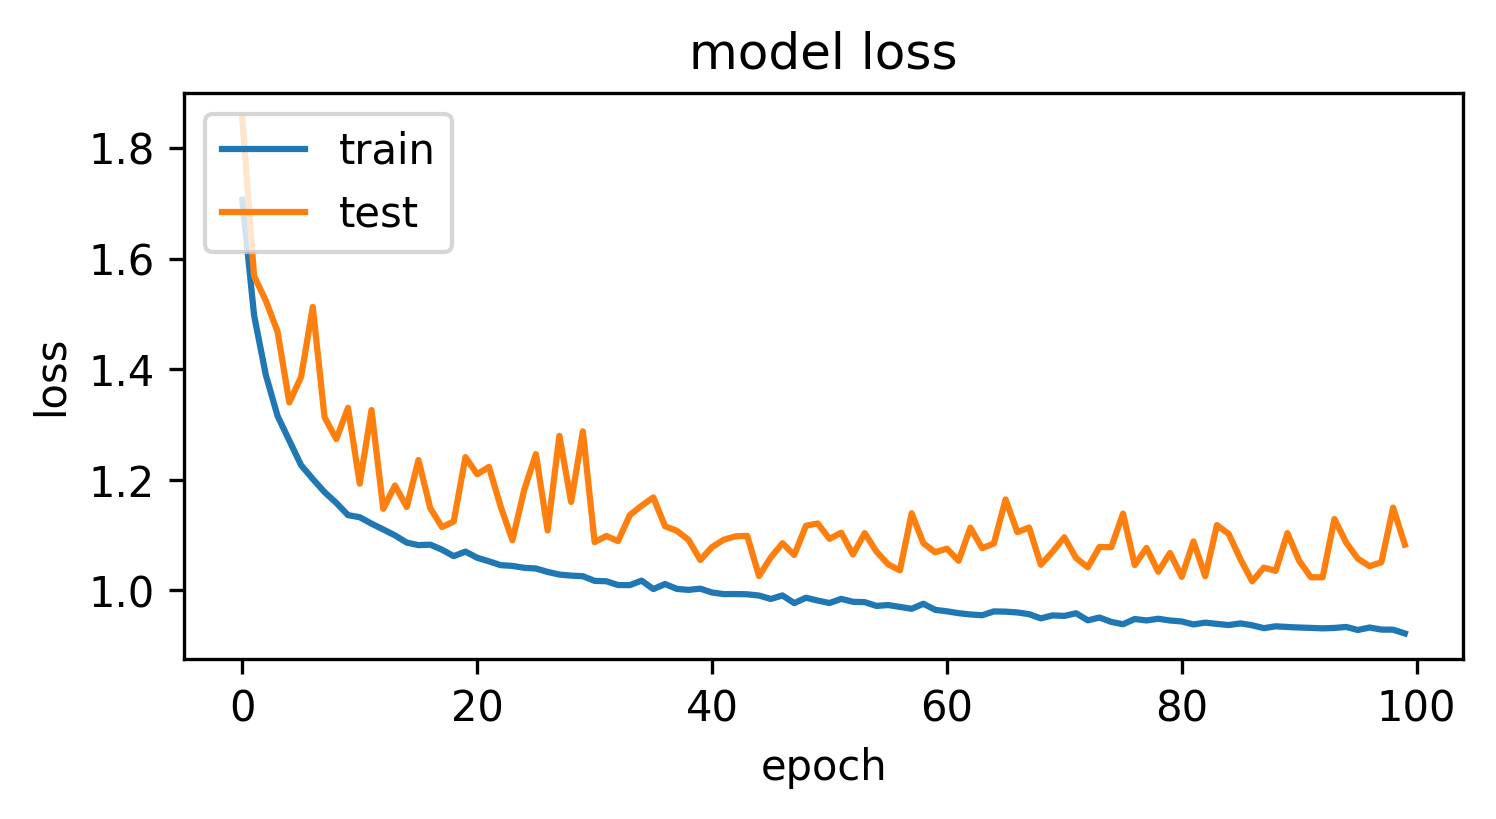
Loss values on training and validation sets allows to see, how our model improves over the time and decide when to stop training:
from matplotlib import pyplot as plt
history.history.keys()
['acc', 'loss', 'val_acc', 'val_loss'] plt.plot(history.history['loss'])
plt.plot(history.history['val_loss'])
plt.title('model loss')
plt.ylabel('loss')
plt.xlabel('epoch')
plt.legend(['train', 'test'], loc='upper left')
plt.show()


