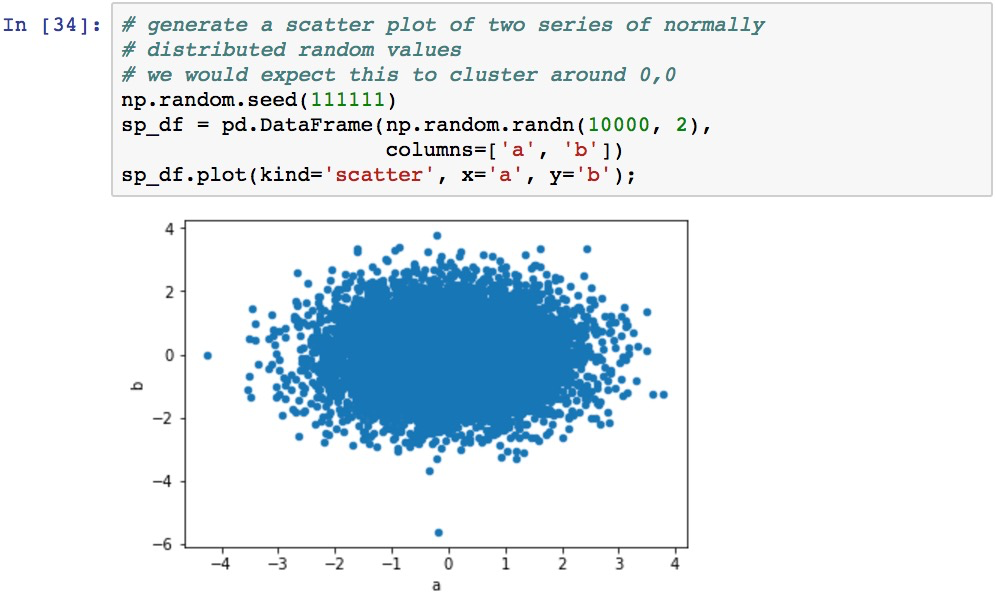
A scatter plot displays the correlation between a pair of variables. A scatter plot can be created from DataFrame by using .plot() and specifying kind='scatter' as well as the x and y columns from the DataFrame source:

More elaborate scatter plots can be created by dropping down into matplotlib. The following code demonstrates the use of Google stock data for year 2016, calculates delta in the closing price per day, and then renders close versus volume as bubbles of different sizes derived from the volume:
Note the nomenclature for the x and y axes' labels, which creates a nice mathematical ...

