Chapter 1. The New Google Analytics 4
This chapter introduces the new Google Analytics 4 (GA4) and explores why it was developed. Weâll see where Google felt its predecessor, Universal Analytics, was lacking and how GA4 means to strengthen those areas with the foundation of a new data model.
Weâll also look at how the Google Cloud Platform (GCP) integration with GA4 enhances its functionality and get a first look at the use cases that will help illustrate the new capabilities of GA4 and get you started with your own data projects.
Introducing GA4
Google Analytics 4 was released out of beta and introduced as the new Google Analytics in early 2021. Its beta name âApp+Webâ was replaced with Google Analytics 4.
The key differences between GA4 and Universal Analytics highlighted in GA4âs announcement post were its machine learning capabilities, unified data schema across web and mobile, and privacy-centric design.
Google had been planning the release of GA4 for many years before its public announcement. After its release, Google Analytics became the most popular web analytics system, yet in 2021 its design still reflected the design goals of the previous 15 years. Although the platform has been enhanced over the years by the dedicated Google Analytics team, there were some modern challenges that were more difficult to solve: users were asking for single customer views for web and mobile apps rather than needing to send data to two separate properties, Google Cloud was a leader in machine learning technologies yet machine learning was not simple to integrate with the GA data model, and user privacy was a growing concern that required tighter control on where analytics data flowed.
When it was first launched in 2005, Google Analytics disrupted the analytics industry by offering a full-featured free version of what had previously been available only in paid enterprise products. Recognizing that the more webmasters knew about their traffic, the more likely they were to invest in AdWords (now Google Ads), Google Analytics was a win-win investment that gave everyone access to the voice of their users as they browsed their website.
By 2020, the analytics landscape was much different. Competitor analytics products were launched with simpler data models that could work across data sources and were more suited to machine learning and privacy (an essential user feature). You could use the cloud to make an analytics system more open, giving more control to analytics professionals. Competing analytics solutions could even be run on Googleâs own cloud infrastructure, which changed the economics of build or buy. The ideal analytics solutions would have sensible defaults for those looking for quick start-up but would be more customizable and scalable to satisfy the more adventurous customerâs needs.
The Unification of Mobile and Web Analytics
While its previous name of âApp+Webâ was replaced with GA4 at launch, the discarded name was more representative of why GA4 was different.
Up until it was sunset in late 2019, Google Analytics for mobile apps (Android/iOS) had its own separate analytics system distinct from web analytics. These software development kits (SDKs) used a different data model that was more suited to app analytics, where concepts like page views, sessions, and users all meant slightly different things, which meant they couldnât be easily compared to the web figures. Users who visited both app and web were usually not linked.
GA4âs data model follows a customizable, event-only structure that was being adopted by mobile apps. Universal Analytics placed limitations on when data could be combined, known as data scoping, which meant that marketers needed to think about how their data fit within scopes such as user, session, or events. These were predetermined by Google, so you were forced to adopt its data model. With GA4âs event-only approach, you have more flexibility to determine how you want your data to look.
When the old Google Analytics for mobile SDKs sunset in 2019, Google encouraged users to instead move over to the Firebase SDKs. Firebase had been developed as a complete mobile developer experience for iOS and Android with an integrated mobile SDK for creating mobile apps from the ground up, now including web analytics. The new GA4 represented an additional data stream on top: the new web stream. Having iOS, Android, and web streams all using the same system means we now have a truly connected way to measure digital analytics across all those sources.
Firebase and BigQueryâFirst Steps into the Cloud
For many marketers, GA4 is their first introduction to the new cloud products that are integral to the operation of GA4: Firebase and BigQuery.
Firebase and BigQuery are both products within the GCP, a broad service Google offers for all manner of cloud services. This book focuses on those products that are part of its data analytics cloud offerings, but be aware that these are just a subset of the whole cloud platform.
Firebase is a broad mobile development framework that now includes Google Analytics. Mobile developers also use it to give serverless power to the mobile apps with useful features such as remote config to change the code of deployed apps without republishing to the app store, machine learning APIs such as predictive modeling, authentication, mobile alerting, and Google advertisement integrations. Firebase is a subset of GCP services that are in some cases a rebrand of the underlying GCP productâfor example, Firebase Cloud Functions are the same as GCP Cloud Functions.
BigQuery can be considered one of the gems of GCP; itâs recognized as one of its most compelling products compared with the equivalent running on other cloud providers. BigQuery is an SQL database tailor-made for analytics workloads, and it was one of the first serverless databases available. It includes innovations such as a pricing model that stores data cheaply while charging on demand for queries and a lightning-fast query engine running on Dremel that offers in some cases 100x speed-ups compared with MySQL. GA360 users may already be familiar with it as one of its features was to export raw, unsampled data to BigQueryâbut only if you bought a GA360 license (this was my introduction to the cloud!). GA4 BigQuery exports will be available to all, which is exciting because BigQuery itself is a gateway to the rest of GCP. BigQuery features heavily in this book.
GA4 Deployment
This book is not an exhaustive guide on GA4 implementation; a better place for that would be the resources outlined in Chapter 10. However, the book does cover common configurations that will give the whole picture, from data collection to business value.
There are essentially three ways to configure capturing data from websites: gtag.js, analytics.js, or Google Tag Manager (GTM). In almost all cases, I would recommend implementing them through GTM, which you can read more about in Chapter 3. The reasons for that are flexibility and the ability to decouple the dataLayer work from the analytics configuration, which will minimize the amount of development work needed within the website HTML. Developer resources will be most effective implementing a tidy dataLayer for your GTM since this will cover all your tracking needs, not just GA4 or Google tags. Any additional changes to your tracking configuration can then be done within GTMâs web interface without needing to involve precious development time again for each minor edit.
With the introduction of GTM Server Side (SS), the configurations possible can also include direct integrations with Google Cloud and backend systems along with modifications of the HTTP callâs requests and responses, giving you the ultimate flexibility.
Universal Analytics Versus GA4
GA4 is said to be an evolution of its predecessor, Universal Analytics (nicknamed GA3 since GA4âs release), but how is it actually different?
One of the first questions people have when hearing about GA4 is âHow is this different enough for me to want to change? Why should I go through the bother of retooling, retraining, and relearning a system that has worked fine for the last 15 years?â This is a key question, and this section examines why.
A dedicated Google help topic also covers this question.
A new data model
The first big change is in the data model itself, covered later in âThe GA4 Data Modelâ.
Universal Analytics was very much focused on website metrics where concepts such as users, sessions, and page views were more easily defined; however, these concepts were more tricky to define for other data sources such as mobile apps and server hits. It often meant that workarounds had to be incorporated or some metrics ignored in the reports when the data came from certain sources. It also meant that some metrics didnât work well together or were impossible to query.
GA4 moves away from an imposed data schema to something that is much freer: now everything is an event. This flexibility lets you define your own metrics more easily, but for users who donât want to get to that level of detail, they also provide default auto event types to give you some of the familiar metrics.
This also means that itâs now possible to automatically collect some data that had to be configured separately before, such as link clicks, so the GA4 implementations should take less experience to implement correctly, helping to lower the barrier of entry for new digital analytics users. Specialist knowledge such as the difference between a session metric and a hit metric will be less critical.
A more flexible approach to metrics
GA4 events can be modified after they have been sent. This lets you correct tracking errors or standardize events (âsaleâ versus âtransactionâ) without needing to modify the tracking scriptsâmuch easier to action.
When creating custom definitions for your own events, there is no predefined schema you need to remember. Create your event with optional parameters, and register it within the GA4 interface to start seeing that event appear in your reports.
BigQuery exports
Previously a GA360 feature, BigQuery exports will now be available even if you donât pay for the enterprise version of GA4. Firebase Analytics for mobile had this feature at launch, and because GA4 is only an addition to that, web analytics has it too.
This is a game changer because typically the most difficult part of a data project is getting access to the raw data beneath your applications in such a way that you can easily work with it. With GA4 BigQuery exports, you need to fill in only a few web forms to get that data flowing in near real time, ready for analytics using BigQuery SQL.
Because BigQuery is so integrated with the rest of GCP, this also means it has tight integrations with the rest of the GCP data stack, such as Pub/Sub, Dataflow, and Data Studio. These services allow you to pipe data directly from BigQuery, and since its APIs are open, it is a popular source or sink for many third-party services too.
This all means that the age-old problem of data silos, where the data you need is locked behind databases with differing company politics and policies, now has a route to a solution by sending it all to one destination: BigQuery. This is how you can start to link across sales and marketing or pull in useful second-party data such as weather forecasts more easily. In my experience, moving all the useful data to one place has had the most transformational effects on a clientâs digital maturity, as one of the most common roadblocksââHow do we get the data?ââis removed.
No samplingâeverything is real time
A motivation for GA360 BigQuery exports was that it was one of the ways you could get unsampled data, and that is also now applicable to GA4. While the sampling limits are improved within the WebUI, the data underneath is always unsampled and available in real time. Should you ever need an unsampled export, it is available via BigQuery or by using the free Data API. This removes the barrier of paying for GA360 to have the data for some use cases that need high accuracy and real-time analytics data sources.
Privacy and digital analytics data
Users are rightly much more aware of the value of their data these days, and privacy has become a hot topic in the industry. There is recognition that users need a fully informed choice to consent to where their data is being used, and it is the websiteâs responsibility to earn trust and correctly value that data. To help with this, Google Consent Mode is available to remove cookies and their stored personal identifiers so they are not available to Google Analytics until a user gives that consent. However, nonpersonal data can still be useful, and GA4 offers a way to model what your data sessions and conversions would look like if 100% of your users consent to giving their data. Since most often your new customers will be those most likely to not yet trust your website or give consent, this can be valuable information to help you improve your performance.
When is GA4 the answer?
Given the changes in GA4, following is a summary of opportunities GA4 offers over Universal Analytics to help with frequently asked questions:
-
How can we integrate our digital analytics data with GCP to make our data work beyond the GA4 services (what this book is mostly about!)?
-
How do we unify tracking users across all of our digital properties, including our mobile apps and website?
-
How can we more easily make bespoke analytics implementations above the defaults?
-
How can we access our digital analytics data to feed into our machine learning model?
-
How can we respect privacy choices but still have some data on the performance of our website?
This section has talked about why you would use GA4 and its key differences from Universal Analytics. The fundamental source of these changes is how GA4 records its data in its new data model, which weâll go into more deeply in the next section.
The GA4 Data Model
The GA4 data model is what differentiates it from Universal Analytics. This new data model enables GA4 to offer its more advanced features. This section looks more deeply at the data model and how it functions.
Key elements of this data model include:
- Simplicity
-
Everything is an event of the same type. No arbitrary relationships are imposed on the data.
- Speed
-
Given the simpler data model, the reduced processing of events allows everything to be done in real time.
- Flexibility
-
Events can be named anything up to your quota limit (500 by default). Parameters can be attached to each event to fine-tune its metadata.
We will now get into the weeds and explore the syntax of how the GA4 event hits are created.
Events
Events are the atomic unit of data capture in GA4. Each action a user makes on your website according to your configuration sends an event to Googleâs servers.
Here is just one event:
{"events":[{"name":"book_start"}]}
Simply counting the number of "book_start" events gives useful information, such as how many people have started the book, the average number of book reads per day, etc.
To ensure a collection of events is associated with one user, those events need a common ID. In GA4, this means also sending a client_id, which is a pseudonymous ID usually found within the GA4 cookie. This is commonly constructed as a random number with a timestamp attached when it was first created:
{"client_id":"1234567.1632724800","events":[{"name":"book_start"}]}
The preceding line is the minimum required data for events sent to your GA4 account.
Note
Timestamps are usually given in Unix epoch time, or the number of seconds since midnight on January 1, 1970. For example, cookies with 1632724800 would translate to Monday, September 27, 2021, 08:39:56 CESTâthe moment I am writing this sentence.
These examples are from the Measurement Protocol v2, which is one way of sending in events. The much more common way is to use the GA4 tracking scripts on your website or iOS or Android app to build and create these events. But I think itâs useful to know what that script is doing.
The same event sent from a web tracker using gtag() would look like the following:
gtag('event','book_start')
The GA4 JavaScript library takes care of the cookie to supply the client_id, so you just need to supply your custom event name.
When using the GA4 tracking scripts, the library tries to help you avoid configuring common event types by providing automatically collected events. These cover useful events such as page views, video views, clicks, file downloads, and scrolls. This is already an advantage over Universal Analytics: what you previously would need to configure now comes standard with GA4. Less configuration means quicker implementations and fewer chances for bugs. To use these automatic events, you can choose which to turn on via enhanced measurement settings.
There are also recommended events, which are events that you implement but that follow a recommended naming structure from Google. These are more tailored to your website and include recommendations for verticals such as travel, ecommerce, or job websites. These are also worth sticking to because future reports may rely on these naming conventions to surface new features. Generic recommended events include user logins, purchases, and sharing content.
Since these automatic and recommended events are standardized, if you do collect your own custom events, make sure not to duplicate their names to avoid clashes and confusions. Hopefully you can see the flexibility of the system in its attempt to provide standardization with sensible defaults to avoid having to reinvent the wheel for each implementation.
Custom Parameters
Event counts alone are not sufficient for a useful analytics system, however. For each event, there can be none or many parameters that give extra information around it.
For instance, a login event will give you the number of logins on your website, but you probably want to break that down by how a user logs inâwith email or a social login. In that case, your recommended login event also suggests a method parameter for you to specify this:
gtag('event','login',{'method':'Google'})
If done with the more fundamental measurement protocol, it would look like the following:
{"client_id":"a-client-id","events":[{"name":"login","params":{"method":"Google"}}]}
Note that we have added an array of params with the extra information.
Ecommerce Items
A special class of custom parameters is items, which are a further nested array within the custom parameters that holds all the item information. Ecommerce usually represents the most complicated data streams because multiple items, activities, and data are associated with sales.
However, the principles are largely the same: in this case, the custom parameter is
an array that holds some recommended fields such as the item_id, price, and item_brand:
{"items":[{"item_id":"SKU_12345","item_name":"jeggings","coupon":"SUMMER_FUN","discount":2.22,"affiliation":"Google Store","item_brand":"Gucci","item_category":"pants","item_variant":"Black","price":9.99,"currency":"USD"}]}
Combine this with the recommended ecommerce events such as purchase and some other parameters, and the full event payload becomes the following:
{"client_id":"a-client-id","events":[{"name":"purchase","params":{"affiliation":"Google Store","coupon":"SUMMER_FUN","currency":"USD","items":[{"item_id":"SKU_12345","item_name":"jeggings","coupon":"SUMMER_FUN","discount":2.22,"affiliation":"Google Store","item_brand":"Gucci","item_category":"pants","item_variant":"Black","price":9.99,"currency":"USD","quantity":1}],"transaction_id":"T_12345","shipping":3.33,"value":12.21,"tax":1.11}}]}
While the preceding code represents some of the most complex events sent to GA4, I hope you can appreciate the simplicity of the underlying model. By using only events and parameters, GA4 can be configured to capture complex interactions on your website.
User Properties
In addition to the event-level data, itâs also possible to set user-level data. This is data associated with the client_id or user_id you have on record. This could be used to set customer segment or language preferences.
Warning
Be mindful here to respect user privacy choices. If you are adding information to a specific user, then laws such as the EU General Data Protection Regulation (GDPR) require that you get consent from the user to collect their data for your stated purpose.
Sending in user properties is much the same as sending in events, but you use the user_properties field instead, as well as any events you may want to send:
{"client_id":"a-client-id","user_properties":{"user_type":{"value":"bookworm"}},"events":[{"name":"book_start","params":{"title":"Learning Google Analytics"}}]}
Using gtag() would look like this:
gtag('set','user_properties',{'user_type':'bookworm'});gtag('event','book_start',{'title':'Learning Google Analytics'});
In this section, we looked at how to send GA4 events in various ways, such as the measurement protocol and gtag, and the syntax of sending events with parameters and user properties. We now move on to how to process those events coming out of GA4 via its integrations with GCP.
Google Cloud Platform
GCP can now be firmly embedded within your GA4 system via its preexisting data analytics systems. It offers real-time, machine learning, scale-to-a-billion services that you pay for only when you use them, while also letting you divest the boring stuff around maintenance, security, and updates. Let your company focus on what it is expert at, and let the cloud take care of the noncore tasks. Via the cloudâs pay-as-you-go payment structure, small teams can create services that previously would have taken many more workforce and IT resources.
In this section, we look at the GCP services you will most likely use when integrating with GA4, the skills and roles your team will need to take advantage of these tools, how to get started, how to manage costs, and how to select the right cloud service for you.
Relevant GCP Services
This book focuses more on the data applications services of GCP, but that is still a vast array of services that are being constantly updated. For a full overview beyond the scope of this book, I recommend Data Science on the Google Cloud Platform by Valliappa Lakshmanan (OâReilly).
The following key cloud services are used in the use cases later in the book and have been essential in my general work. There are many different cloud services, and choosing the right one can be a bit bewildering when you are starting out. I suggest looking at the services highlighted here as useful ones to get started with.
We will become familiar with the following services in the book, in rough order of usefulness:
- BigQuery
-
As mentioned already, BigQuery will feature heavily as both a destination and source for analytics and data workloads. It even has modeling capabilities with BigQuery ML.
- Cloud Functions
-
The glue between services, Cloud Functions let you run small snippets of code such as Python in a serverless environment.
- Pub/Sub
-
Pub/Sub is a message queue system that guarantees that each message is delivered at least once at a scale that can handle the entire internet being sent through its queue.
- Cloud Build
-
Cloud Build is a continuous integration/continuous development (CI/CD) tool that lets you trigger batched Docker containers in response to GitHub pushes. Itâs a hidden workhorse behind several of my solutions.
- Cloud Composer/Airflow
-
Cloud Composer/Airflow is an orchestrator that lets you reliably create complicated interdependent data flows, including scheduling.
- Dataflow
-
Dataflow is a batch and streaming solution for real-time data that is well integrated with lots of GCP services.
- Cloud Run
-
Cloud Run is similar to Cloud Functions but lets you run Docker containers containing any code you like.
There are usually a few ways to create what you need, and the differences may be subtle, but I recommend that you be pragmatic and get something that works first, then optimize which exact service may be better to run it later on. For instance, you may have a daily data import running on a BigQuery scheduled query but find as your needs get more complex that Cloud Composer is a better tool to coordinate the import.
All of these tools are not point and click, however. Coding is required to get them to deliver what you need, so we will go over what skills you need to deliver on their capabilities in the next section.
Coding Skills
One of the most daunting aspects of applying these integrations may be that it calls on skills that you may think only computer programmers have. Perhaps you consider yourself ânontechnical.â
I used to think the same thing. I remember at the start of my career saying, âI donât know JavaScriptâ and waiting six weeks for time to free up for a developer to enact a five-line bit of code on a website. Once I found the time and the inclination, I started to have a go myself, making lots of mistakes along the way. I also learned that the professionals also made lots of mistakes, and the only difference was that they had the motivation to keep going. Another realization was that a lot of what I was doing in Excel was actually more complicated and more difficult to work with than if you were using a tool more suited for the job. Solving the task in Excel needed more brain power than doing it in R, for example.
So if you are inclined, I would urge you to keep going. If itâs hard, itâs not necessarily because you donât have the talentâthese things are alien to everyone at the beginning. Coding can seem incredibly fussy in some cases, and things can go wrong if you miss a single â;â. However, once you learn one area, the next is a bit easier. I started by being a power user of Excel, then learned Python and JavaScript, then fell in love with R, then had to learn to appreciate SQL and bash, and now dabble with Go. The nature of programming is that, as you learn and get better, the code you look at from six months ago will look awful. This is natural; the important thing is to be able to look back and see progress. Once you get something working, that is experience, and it slowly grows until 10 years later when youâre sitting down writing a book about it.
For me, open source was also a way to sharpen my skills, since putting code out in the open and getting feedback was a multiplier on top of any experiences I had running that code. This is why Iâm so grateful for any feedback I get today, in GitHub or otherwise. The code in this book will also be available on a GitHub repository to accompany the book, which I will endeavor to keep updated and free of bugs.
Note
By the same logic, if you read some of my code and have some feedback on how it can be done in a better way, please do get in touch! I am still always learning.
The use cases in this book include code examples that cover the following languages:
- JavaScript
-
This is essential for all web pageâbased tracking involving HTML and is most commonly used for data capture via tags. It is also heavily used within GTM to create custom templates.
- Python
-
A very popular language that is supported by a wide range of platforms, Python is useful to know as it can be considered the second-best language for everything. It has strong machine learning representation as well, although you probably wonât need that unless youâre working on advanced implementations.
- R
-
Although you could get away with just using Python, Râs data science community makes it the best language for data science in my opinion. Its libraries and open source community cover everything from data ingestion all the way to data activation via interactive dashboards and reports. I attribute most of my thinking on how to approach data workflows to the mindset I got from R, so it influences projects even when itâs not directly used.
- bash
-
When interacting with cloud servers, they will most likely be using Linux-based systems such as Ubuntu or Debian, which rely on bash to operate rather than a graphical interface such as Windows. Itâs also handy to know some command-line bash programming when dealing with very large files that arenât easily imported into other languages. gcloud and other CLIs also assume some knowledge of shell scripting, the most popular being bash.
- SQL
-
In most cases, the raw data youâre working with will be in a database, and SQL will be the best method for extracting it. SQL also introduces a way of thinking about data objects that is helpful.
While it may be possible to copy-paste your way to victory, I really recommend going through line by line and at least understanding what each section of the code is doing.
Assuming you now have some coding available, either through your own skills or your teamâs, we now move to how to get started on GCP and deploy your first code to the cloud.
Onboarding to GCP
GCP is a major component of Googleâs business, and it has flows that are completely separate from Google Analytics that you will need to learn to navigate.
You can get started for free, but the first thing to know is that for anything serious, youâre going to need to add a payment card for your cloud usage. However, you may get several months of usage covered by the onboarding vouchers available.
Googleâs start-up page will guide you through your first login.
Tip
If you have an existing Google Cloud Project, it may still be worth creating a new one for the examples in this book to ensure they are activated with the latest versions of APIs. For example, you will most likely need to activate the Google Analytics Reporting API, Google Analytics Admin API, and Cloud Build API, and check that the BigQuery API is active by default.
Moving Up the Serverless Pyramid
Truly unlocking the power of the cloud involves an evolution in thinking about how to tackle IT problems using its strengths. Companiesâ first step in the cloud usually involves a âlife-and-shiftâ model where they simply replicate what they had running locally within the cloud, such as a local MySQL database replaced by a cloud server running MySQL. Another strategy is âmove and improve,â which involves, for example, putting your MySQL database within Google Cloud SQL, a managed instance of MySQL.
However, a âlift-and-shiftâ model will yield only minor benefits compared to the full potential of the cloud. For a company to achieve true digital transformation, it needs to embrace the higher metaservices built on top of the fundamentals of compute and storage, with the provision that doing so will necessarily tie you a bit more to that cloud providerâs service.
The cloud companiesâ pitch to use these services is that you divest the IT resources to maintain, patch, and develop the services built and instead invest in using the applications built on top in a more on-demand manner. It is undoubtedly this model that has enabled me to write this book, as without cloud computing, creating your own services would be much more complicated and limit your ability to experiment with solutions. When IT resources are effectively outsourced, much smaller teams are needed to achieve results.
An example of this is BigQuery. Creating your own BigQuery service would require you to invest in having huge server farms at the ready, which cost money when idle just so theyâre available when you need the resources for a âbig query.â Using the BigQuery service for the same query, those resources are bought online as necessary, and you effectively pay for only the seconds they are running.
To illustrate this, I find the diagram of the serverless pyramid in Figure 1-1 helpful. It outlines some of the services and the trade-offs you get when youâre selecting a service to run your use case.
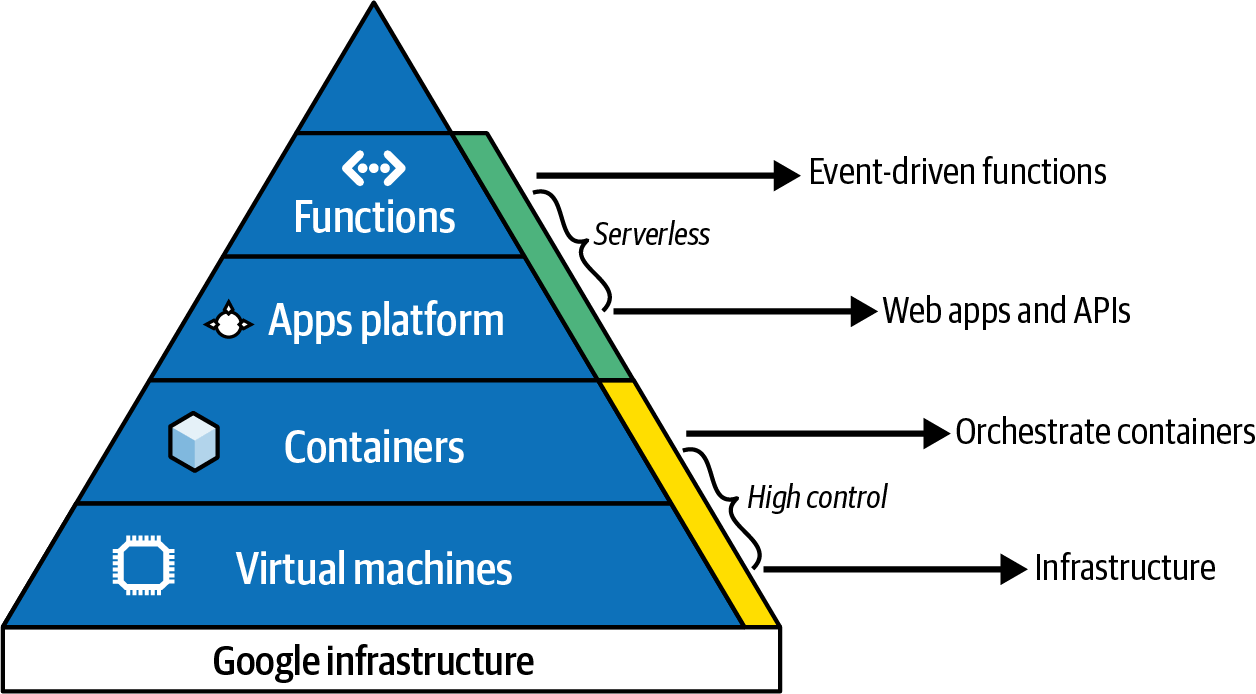
Figure 1-1. GCP pyramid hierarchy
At the bottom level, you have virtual machines and storage, which are basically cloud versions of the computers running on your desktop. If you want complete control of configuration, you can fire these up with some cloud advantages like backups, security, and patches. This layer is sometimes referred to as infrastructure as a service (IaaS).
At the next level, you have services that run virtual machines and storage for you but abstract it away so you only have to worry about the configurations you need. App Engine is an example of this, and this layer is sometimes referred to as platform as a service (PaaS).
At the level above that, you have yet another level of abstraction running on top of the equivalent PaaS. These services are usually more role-driven, so services like analytics data warehousing (BigQuery) are available. This is sometimes known as database as a service (DBaaS).
And even above that, you can have services that take out some of the configuration to provide even more convenience. Often you need to supply only the code you need to run or the data you want to transform. Cloud Functions is an example: you donât need to know how the function executes its code but just specify how you want it to run. This is referred to as functions as a service (FaaS).
With this in mind, you can judge where your application should sit. The services at the top of the pyramid typically have a greater cost per run, but if you are under a certain volume or cost of implementation, they still represent a massive cost savings. As you need to own or scale more of the infrastructure, you may consider moving down the pyramid to have more control.
The use cases in this book aim to be as high up the pyramid as possible. These services are usually the latest developments and quickest to get started with, and will give you the scale to serve you up to your first billion users.
And that is truly now within reachâa consideration when selecting your service is how much it will be used, which can include up to global Google scale. Perhaps you donât need it right now, but it is still worth considering in case you need to reengineer your application should it prove unexpectedly successful.
This is where being far up the pyramid (as detailed in Figure 1-1) is helpful, as those services usually have autoscaling provisioning. These should be limited to avoid expensive mistakes, but essentially, if you have the money, then you should expect similar performance for one thousand users as you would for one billion. Further down the hierarchy, you still have options, but you would need to be more involved in the configurations of when and where you should apply that scale.
Wrapping Up Our GCP Intro
This has been a brief whirlwind tour of why the cloud is so powerful and how its power can be applied to your GA4 implementation. We spoke of how the cloud puts resources in your hand that only a few years ago wouldâve required a large IT team to enable, and we also talked about the concepts of serverless versus lift-and-shift models for how you may approach this. This will involve an expansion of your digital roles to include the coding languages that help enable such services, with the promise that investing in those skills will make you an overall more effective digital marketer. The majority of this book will cover how to put this into practice, with some example use cases on things you can do right now.
Introduction to Our Use Cases
This book introduces all the concepts and technologies that are relevant for GA4 integrations, but theory and planning can go only so far. The real way I learned the skills discussed in this book was by implementing applications. I made mistakes along the way, but those mistakes were often the most valuable learning experiences, because once you debug why something went wrong, you gain greater understanding of how to get it right.
To help jump-start your own journey, once all the building blocks necessary for your own applications are introduced in the following chapters, our use cases in Chapters 7, 8, and 9 are dedicated to technical use cases detailing the whole lifecycle of a GA4 data application including code examples: creating the business cases, technical requirements, and decisions about what technologies to use. If you follow along with everything in sequence, by the end you should have a working integration.
Warning
In practice, you may accidentally skip certain steps and have to go back and carefully read what you missed. Also, by the time you implement a particular use case, the technologies may have changed slightly and need updating.
Even with a perfectly implemented example, itâs unlikely that it will match exactly what your own business needs or what it should prioritize. The use cases cover my experience of common customer problems, but your own will undoubtedly be slightly different. Because you will most likely need to adapt the use cases for your own needs, it is important to understand not only what to do but also why we are doing it one way rather than another. You will then be able to adapt the process to better suit your own priorities.
Despite your individual requirements, some common themes can be tied together in relation to how to approach these projects. Chapter 2 covers a framework that every successful data integration project Iâve worked on has had in common. The use cases will follow this framework to give you practice in applying it. The four main areas are data ingestion, storage, modeling, and activation. However, the question the use case is asking is the main driver of all this, because if you are trying to solve a problem that isnât actually going to help your business when solved, the whole endeavor will not be as effective as you wish it to be. Finding the right problem to solve is important for your own business, which is why in Chapter 2, weâll also go through some questions you can ask to help you define it.
The practice use cases will allow you to concentrate solely on the practical work of implementation. The best way to learn will be to follow along and implement them rather than just reading through them. They can also act as a reference when youâre implementing your own use cases, as you can often reuse aspects of one solution within another. For example, all the use cases in this book use GA4 as a data ingestion source. The use cases also try to use several different technologies to cover a broad range of applications.
Use Case: Predictive Purchases
The first use case in Chapter 7 is a baseline to help you get used to the overall approach that shares its structure with the more complex use cases later in the book. Weâll use only one platform, GA4. The same principles still apply to the more involved use cases, but this should also show how itâs possible to swap out GA4 for other applications should it better serve your needs. This case uses several of GA4âs new features, including its machine learning and audience exports.
Predictive purchasing uses modeling to predict if a user will buy in the future or not. This can be used to alter the site content or advertising strategy for those users. For instance, if the probability that a user will make a purchase is above 90%, perhaps we should suppress marketing to that user because the job is already done. Conversely, if a purchase probability is under 30%, perhaps we should consider that user a lost cause. Enacting such a policy means that you can move your budget allocation to target just the 60% of users who may or may not buy. This should drive down your cost per acquisition (CPA) and potentially increase your sales revenue.
To do this, we will use GA4 to do the following:
-
Collect data on the website including conversion events
-
Store all the data we need
-
Provide data modeling using its predictive metrics like purchase and probability
-
Export to Google Ads for activation using GA4âs Audiences
This process is illustrated in the simple data architecture diagram in Figure 1-2.
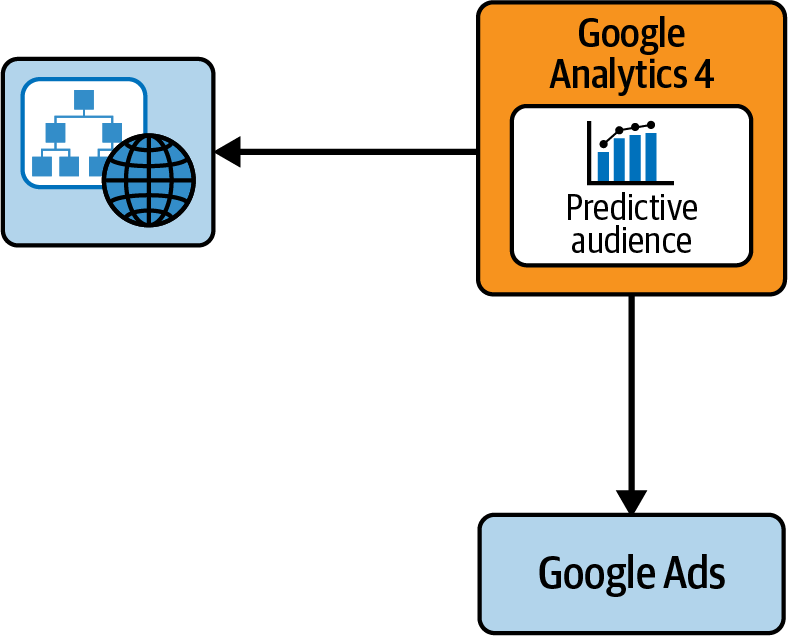
Figure 1-2. Data architecture for the predictive audiences use case
No programming will be required to enact this, and all configuration will be done within the UI.
Predictive metrics is a feature integrated within GA4 and makes direct use of Googleâs capabilities in machine learning to make a real difference in how your business operates. However, your website needs to meet certain criteria to qualify for using the predictive metrics feature, which puts you less in control of when the feature can be used. If you canât use predictive metrics, you may still be able to use your own data and build the model yourself and then use the Google Ads integration later. Weâll cover this in the next section.
Use Case: Audience Segmentation
The audience segmentation use case in Chapter 8 shows you how to better understand the aggregate behavior of your customers. What common trends or behaviors can you pick out so you can better serve that segment? How many types of customers do you have? Do the data-driven segments youâve found match the assumptions of your business?
Such segmentation projects have historically been used to help personalize marketing messages for those users. For instance, certain customers may be identified as being more likely to buy cross-sell products, so you can limit marketing messages to just those customers to reduce campaigns costs and avoid unnecessary messaging to customers who may get annoyed by them.
You can segment on many different criteria. A successful method that predates the internet is the RFM model that looks at the recency, frequency, and monetary behavior of users and segments those with similar scores in each sector. With the wealth of data available now, you can make other models with hundreds of fields. The model you choose will be largely governed by your use caseâs business requirements as well as its privacy considerations. Privacy is important here as it may be necessary to collect consent from users to include their data within models. If you donât collect consent, the customer may get annoyed if theyâre targeted.
Using this example, we would like our Google Ads costs to be more efficient. In this context, Google Ads will take on the data activation role since that is where we will send data to make a change in user behavior. Our business case is to reduce costs as well as get higher sales if we can tailor our messaging more tightly.
Weâd like to use the data we have about a customerâs website behavior and their purchase history to determine if we should or should not show them certain ads. To do so, we will use the following:
-
GA4 and our customer relationship management (CRM) database as the data sources
-
Cloud Storage and BigQuery as our data storage
-
BigQuery to create our segments
-
Firestore to push those segments to our GA4 users in real time
-
GTM SS to enrich the GA4 data
-
GA4 Audiences to push those segments to Google Ads
Interactions between these services are shown in Figure 1-3.
Along the way, weâll also ensure that privacy choices are respected and that no personal data is exported or transferred where it is not needed.
The technologies weâll use for the following services will be covered in the relevant chapters in more depth later:
-
GA4 for web measurement
-
A production database for user purchase history
-
Imports via Cloud Storage, Pub/Sub, and Cloud Functions
-
BigQuery for creating the segmentation models
-
Cloud Composer to schedule the updates
-
Cloud Storage, Pub/Sub, and Cloud Functions to import the segments to GA4
-
GA4 to create the audiences
Youâll need skills in Python and SQL as well as some configuration work within GA4, the Google Cloud console, and Google Ads. Weâll also need to make sure that weâre collecting the right data within GA4 so we can link the web activity with the CRM data in a privacy-compliant manner.
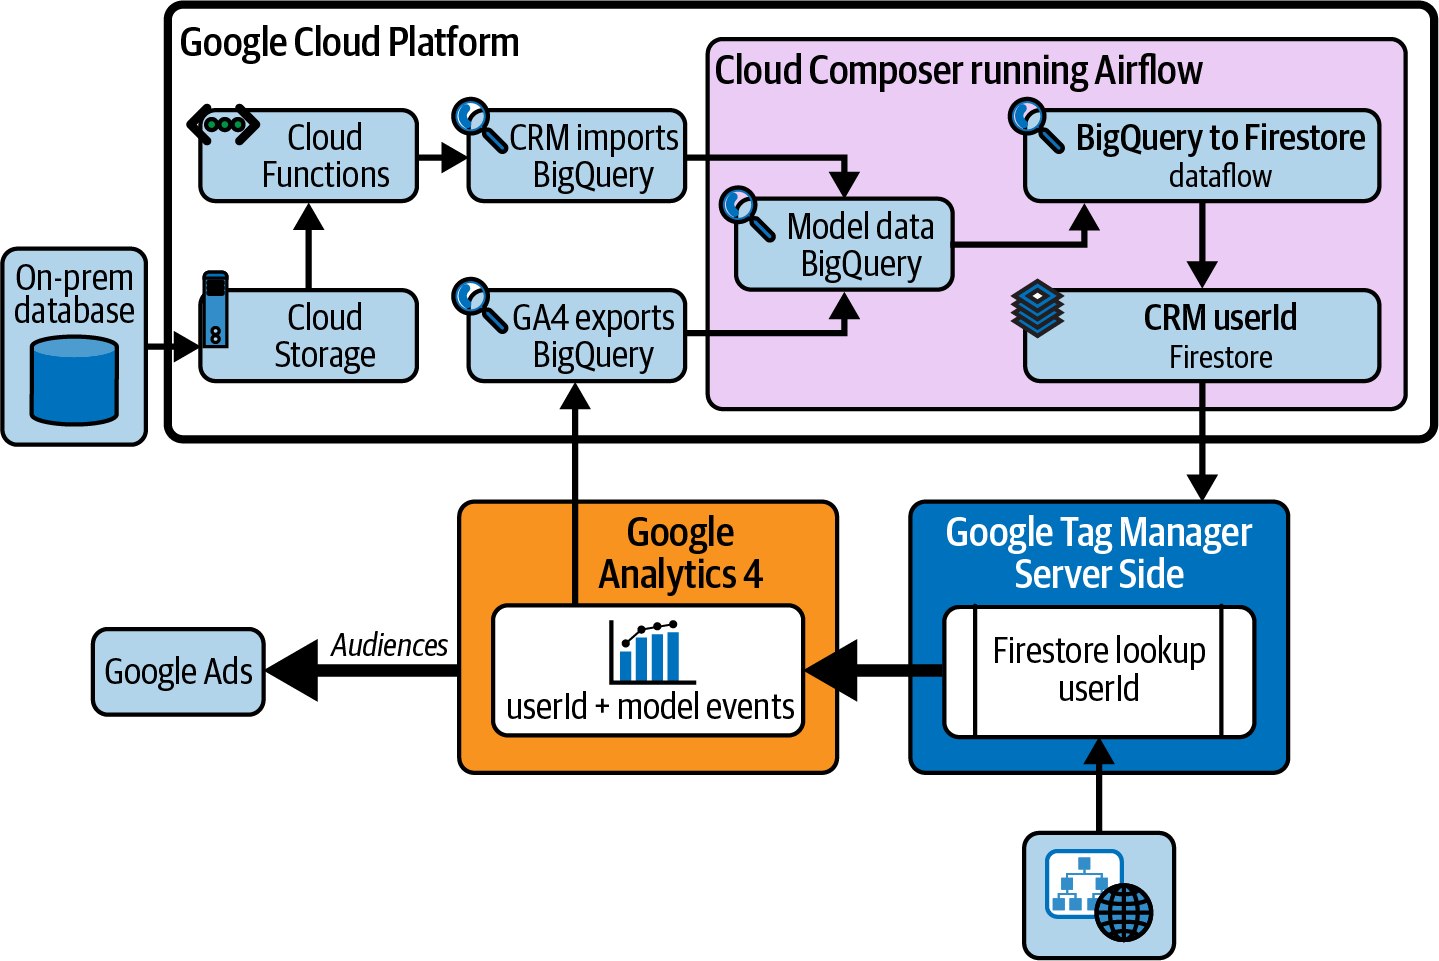
Figure 1-3. Data architecture for the user segmentation use case
Use Case: Real-Time Forecasting
The use case in Chapter 9 is about creating a real-time forecasting application. Real-time analytics is often a first ask for companies when theyâre getting into analytics, but it is usually deprioritized if they discover they canât react to that data stream in real time. However, if you do have that ability, itâs an exciting project to work on because you can see the immediate benefits.
A good example of this use case is a publisher newsroom that is reacting to real-time events during the day when choosing which stories to publish or promote. In a company where clicks and views mean revenue, a social media viral hit can make a big business impact. To get that hit takes repeated attempts, editing and promotion on the home pages, and constant real-time feeds of trending social media topics and sentiment. The use case we detail here shows how to take that stream of web analytics data and forecast what that traffic will do based on current uptake. You can make these forecasts on GA4 Audiences that have been set up to identify different segments of your customers.
This use case will demonstrate using Docker to handle running the dashboard solution on Cloud Run, running Râs Shiny web application package. A key reason to use Docker is that you can swap out code that is running within the containers with any other language, so Python, Julia, or another future data science language could be substituted. The data roles for this project include:
-
Data ingestion via APIs
-
Data storage within the application
-
Data modeling in R
-
Data activation via an R Shiny dashboard
To achieve this use case, weâll need the following:
-
GA4 to collect the real-time web event stream
-
Cloud Run to run the dashboard
-
GA4 Audiences to have a useful segment to forecast
Figure 1-4 shows how these resources connect with one another.
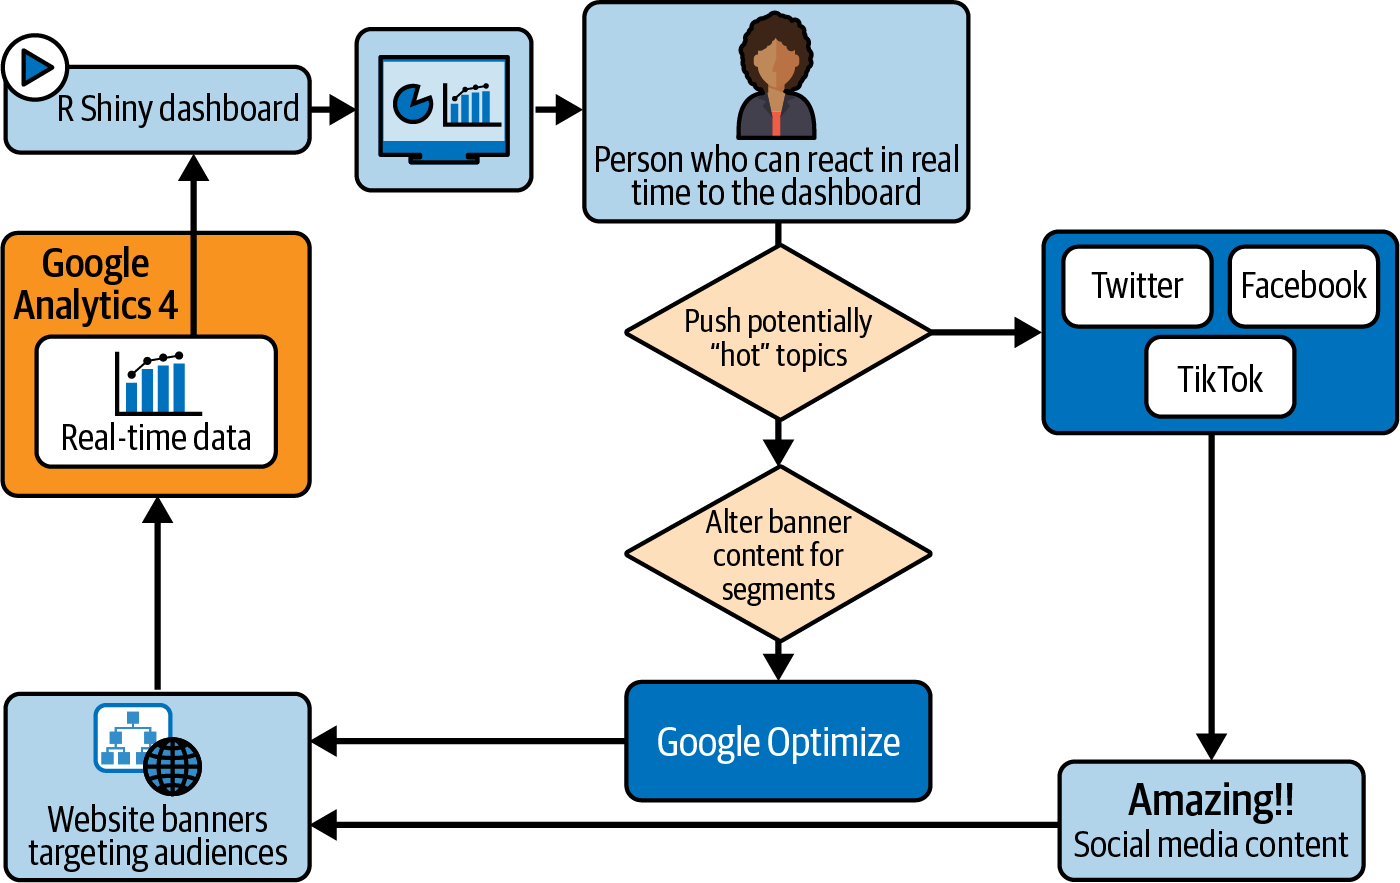
Figure 1-4. Real-time data is taken from GA4 and a forecast is created to help prioritize content for social media and on-site banners via Google Optimize
Weâll use some R skills to create the real-time feeds and modeling, and weâll use some dashboard visualization skills to make the dashboard.
Summary
This chapter introduced the main ways to use GA4 to advance your digital analytics implementations. We explored why GA4 was created in the first place and how it differs and improves upon Universal Analytics with its new simpler data model. We also explored how its integration with GCP opens up your digital analytics to a whole new world of applications involving services such as Firebase and BigQuery. Although using these new cloud services requires new skills like coding, the new services of the cloud make this more accessible than in the past. Serverless architecture offerings have made it possible to abstract away a lot of the legwork in configuring and scaling up compute services. A general recommendation when starting out is to aim to use services as far up the architecture as possible to keep the barrier of entry as low as possible.
Even though the technology is now available, how to approach and best use it is a key skill that may be unfamiliar to digital marketers who havenât used the cloud before, so in Chapter 2, we set up the general framework and strategy for creating successful data analytics projects that can be repeated over many projects. Weâll develop the roles of data ingestion, data collection, data modeling, and data activation from a strategic perspective, ready for the practical implementation chapters that follow.
Get Learning Google Analytics now with the O’Reilly learning platform.
O’Reilly members experience books, live events, courses curated by job role, and more from O’Reilly and nearly 200 top publishers.

