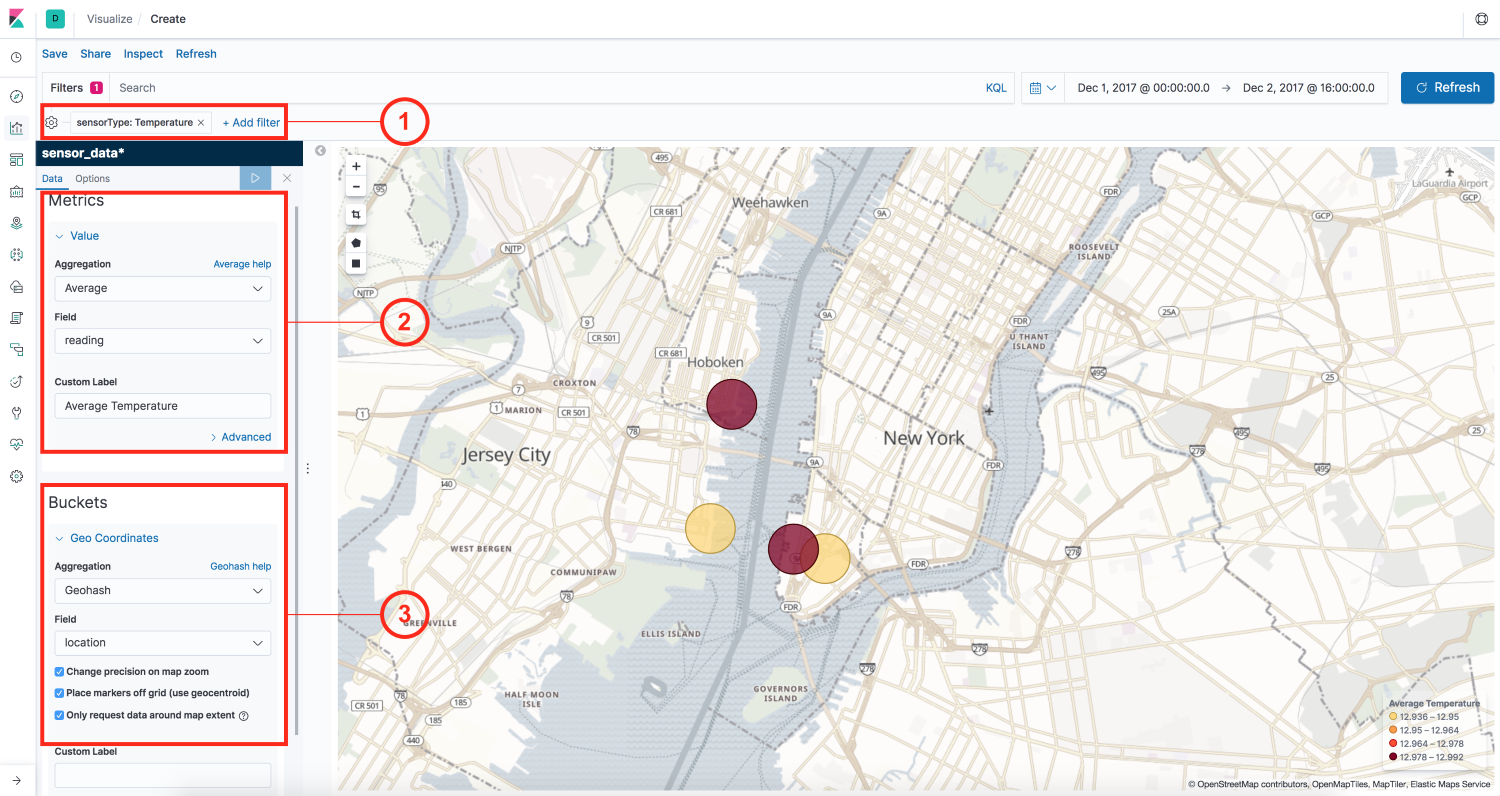
We can visualize temperature and humidity over the map using the Coordinate Map visualization. Create a new Coordinate Map visualization by going to the Visualize tab and clicking the + icon to create a new visualization, and perform the following steps as shown in the following screenshot:

- As in previous visualizations, add a filter for the sensorType: Temperature.
- In the Metrics section, choose Average aggregation on the reading field as done previously.
- Since this is a Coordinate Map, we need to choose the

