Let's have a quick overview of the architecture of the planned system. As mentioned before, we have our microservices, the Prometheus server, and Grafana. Furthermore, everything will be deployed to Kubernetes. The following diagram shows the relationships:
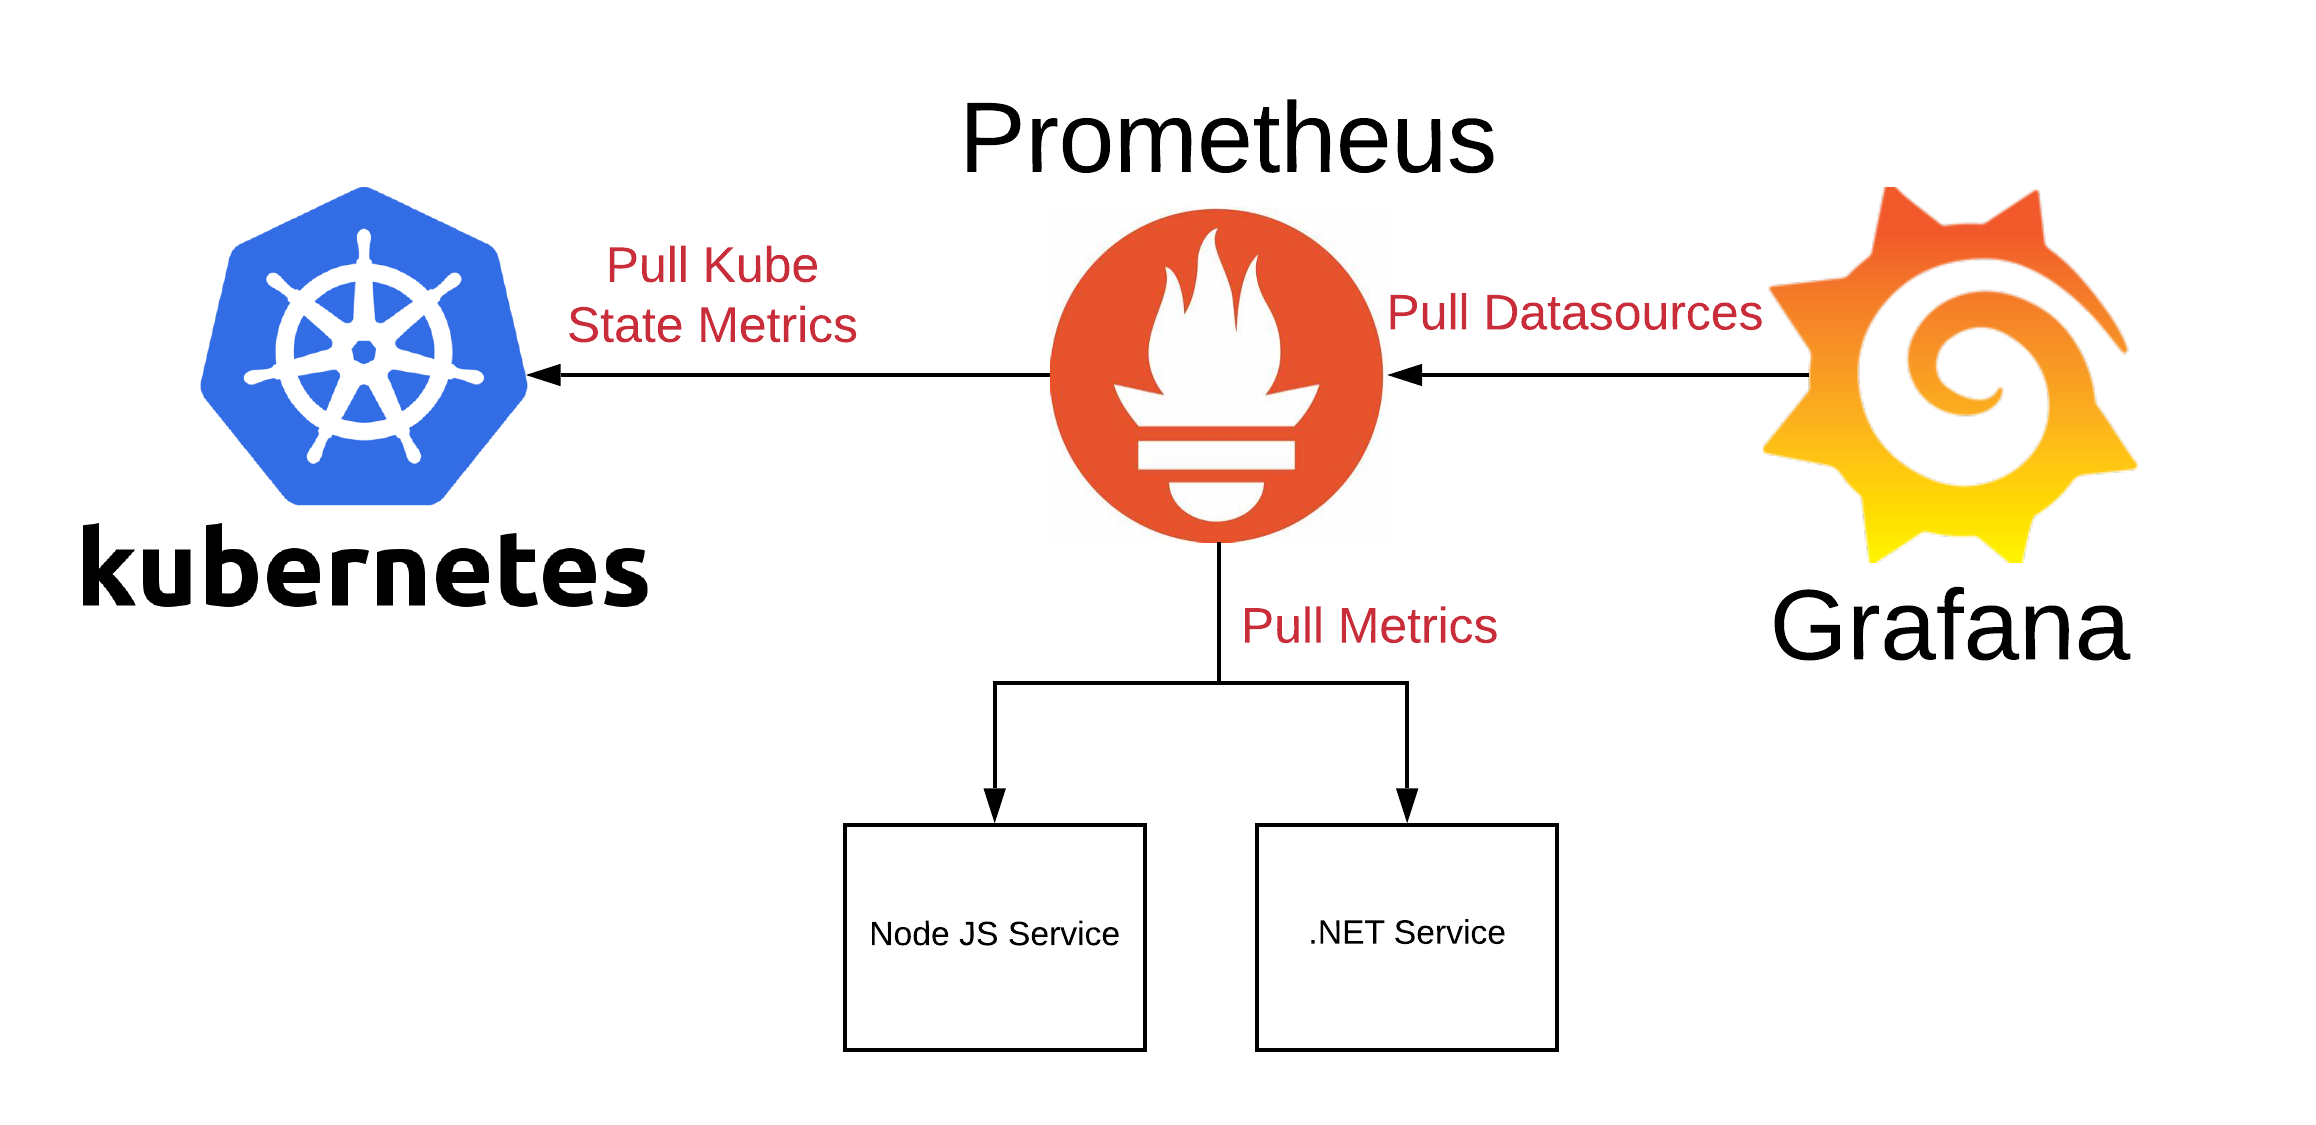
High-level overview of an application using Prometheus and Grafana for monitoring
In the top center of the diagram, we have Prometheus, which periodically scrapes metrics from Kubernetes, shown on the left. It also periodically scrapes metrics from the services, in our case from the Node.js and the .NET sample services we created and instrumented in the previous section. Finally, ...

