When we plan our sprint in a Jira Software scrum-based project, we have the option to estimate our work using either story points or the number of hours. The following report shows the progress of the issues in a specific sprint based on the total estimated effort versus the actual effort:
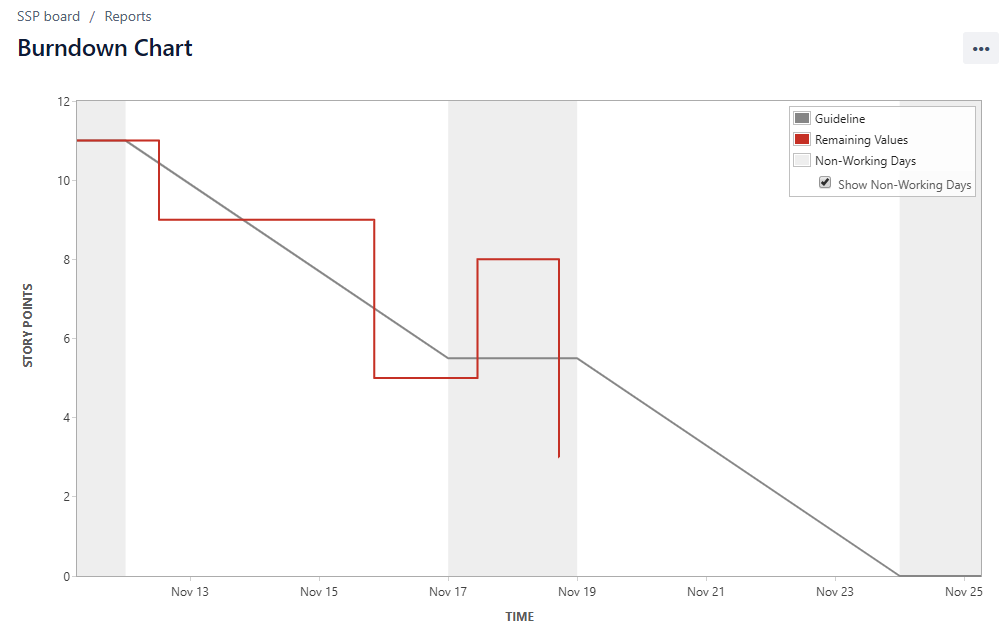
Figure 5
If you look at the preceding chart, you will notice that in the beginning, the total story points planned were 11 and, based on the sprint duration, ideally, the total story points should be burned by the end of the sprint. This is represented by the baseline going down. As the work begins, another line representing the actual completion ...

