Another important report that we will discuss is the velocity chart, which actually talks about the capacity of the team. Let's first look at the report, illustrated as follows:
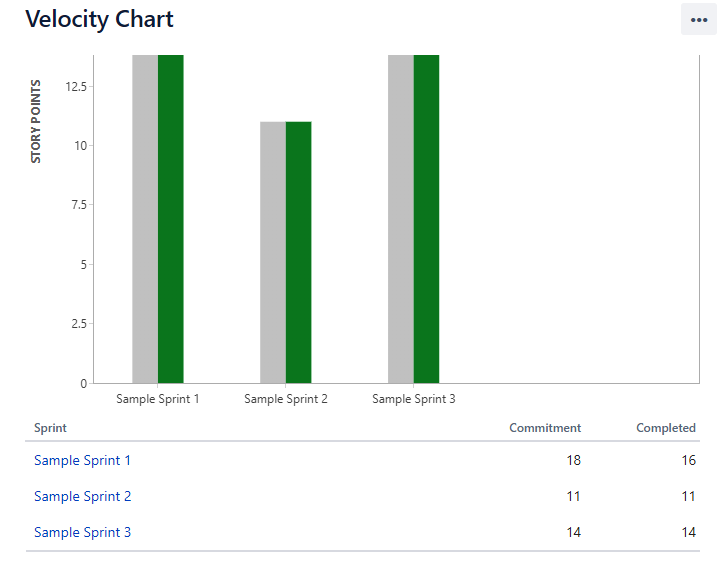
Figure 6
When the sprint is planned, an estimation is done regarding the work that can probably be finished by the end of the sprint. At the start of a new project, this is a little difficult to estimate. Also, as the project progresses, team members might change or become unavailable, so it is very important to know the current capacity of the team.
The preceding chart tells us that in Sample Sprint 1, the team's commitment was 18, but 16 completed, ...

