In this section, we will have a look at the G1 GC logs in detail.
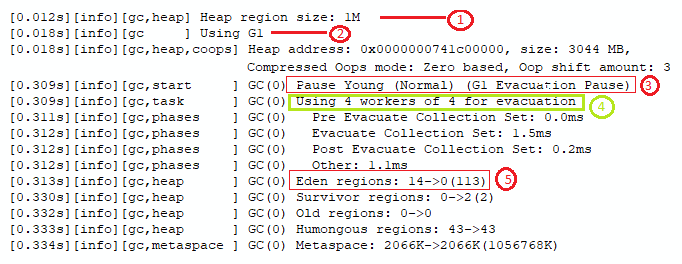
The following features are marked in the following screenshot:
- Each heap region is of the size, 1M.
- The JVM is using G1 as its GC.
- The G1 collector starts a young collection 0.309 seconds after starting the application execution.
- The G1 collector uses multiple threads for the young collection.
- The G1 collector moves live objects from 14 Eden regions to 2 Survivor regions:

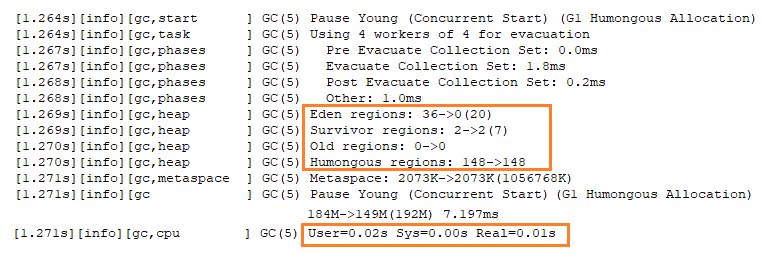
Let's examine another section of the same GC log, as follows:

The logs in ...

