Reading a Histogram
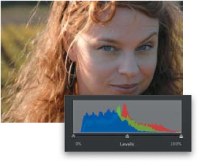
A histogram is a bar graph that shows how much black, white, and mid-tone data a photograph has. Pure black is on the left, pure white is on the right, and the mid-tones are in between. iPhoto displays a color histogram that breaks this information down into an image’s three primary-color channels: red, green, and blue.
Beneath the histogram is a set of sliders that let you change what iPhoto considers to be pure black, pure white, or mid-tone values.
A Sampling of Histograms
This properly exposed shot has a good distribution of dark, bright, and mid-tone areas.
This overexposed shot has very little data in the blacks; everything ...
Get iPhoto ’11: The Macintosh iLife Guide to using iPhoto with OS X Lion and iCloud now with the O’Reilly learning platform.
O’Reilly members experience books, live events, courses curated by job role, and more from O’Reilly and nearly 200 top publishers.

