156 Internet of Things
machine can be understood as a machine that is capable of defining various states of an object
and these states can be controlled by internal or external events. These diagrams are used to
model the lifetime of an object.
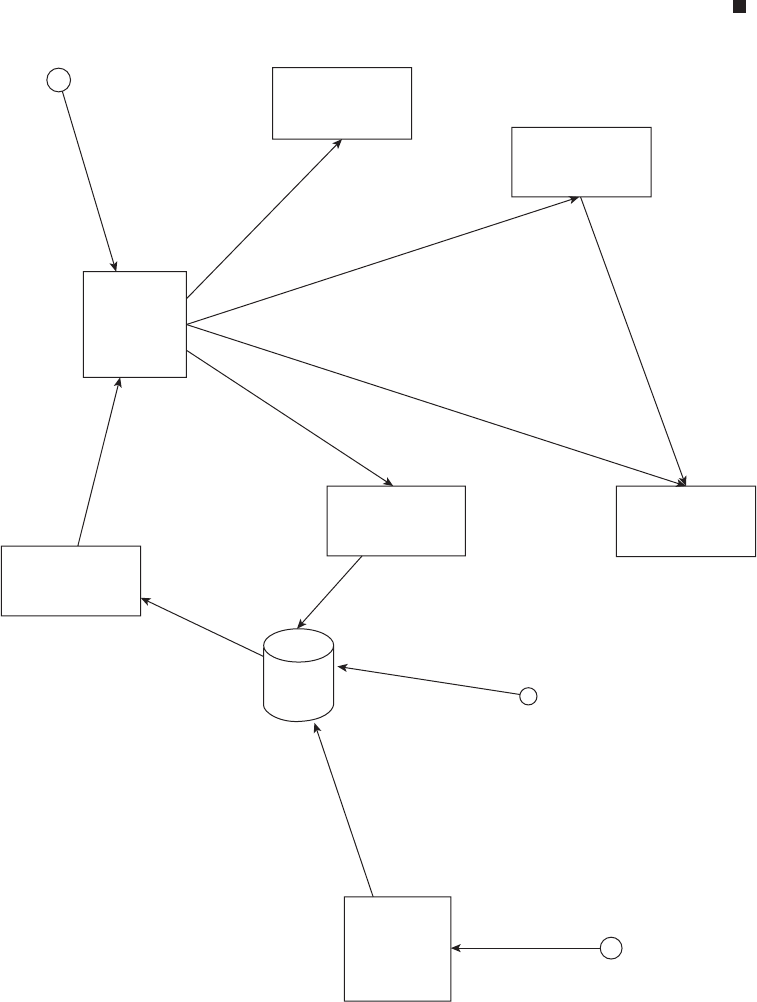
Why Do We Use State Chart Diagrams?
The State Chart Diagrams come under the five other UML diagrams utilized to model the
dynamic nature of the system. State chart diagrams are very useful in modeling reactive systems.
A reactive system is characterized by a system that could respond to internal or external events.
These diagrams help us to explain the flow of control from one state to another. A state can be
understood as a condition under which an object can exist and it can change itself under the trig-
ger of some event. Thus, a State chart diagram could be used to portray the lifetime of an object
from its birth to death. Some people also use these diagrams for forward and reverse engineering
of a system. However, the main purpose remains the same as modeling reactive systems.
We can use a State Chart Diagram in the following:
• It can be used to portray the dynamic aspect of a system.
• It can model the lifetime of a reactive system.
• It can describe how an object transformed into different states during its lifetime.
• It can explain a state machine to portray the state of an object.
How Can We Draw a State Chart Diagram?
So far, we understood the motive of State Chart Diagram. We should also know that the
emphasis is also drawn on the state changes by some internal and external event. These states
of the objects are very important to evaluate and implement them accurately. States can be
classified as the condition of objects when a particular event takes place.
We must clarify on these three points:
• Identifying the important objects to be evaluated,
• Identifying the states, and
• Identifying the events.
The State Chart Diagrams give control to model states and also the events that are operating on
the system. When we are implementing a system, it is very crucial to know the dierent states of
an object during its lifetime, for this requirement we use State Chart Diagrams. These diagrams
are mainly utilized to analyze the object states that are influenced by the events. Together this
analysis of the objects is very helpful in order to understand the behavior of the system.
Component Diagrams
Component diagrams are a bit dierent from the other UML diagrams in terms of behavior
and nature. They are very helpful in breaking down the actual system under development into
dierent high levels of functionality. Each component in the system has one clear goal and
only interacts with other essential elements. Component diagrams are utilized to portray the
physical attributes of a system. In these physical attributes, we include elements such as librar-
ies, executable, files, and documents. These diagrams are utilized to envision the organization
and relationships between components in a system. We can also use such diagrams to create
executable systems.
Internet_of_Things_CH06_pp141-170.indd 156 9/3/2019 10:14:20 AM

Chapter 6 Essential Elements for Designing IoT Architecture 157
Card Reader
ATM Network
ATM
ATM Transaction
Cash Dispenser
Card validator
Customer Console
Bank
DataBase
Account Information
Client Deskto
pClient Desktop Transaction
Why Do We Use Component Diagrams?
Component diagrams do not explain the functionality of the system, instead they help us to
explain the components used to create such functionalities. These components could be
packages, libraries, files etc. These diagrams can also be explained as a fixed implementation
Internet_of_Things_CH06_pp141-170.indd 157 9/3/2019 10:14:20 AM
Get Internet of Things now with the O’Reilly learning platform.
O’Reilly members experience books, live events, courses curated by job role, and more from O’Reilly and nearly 200 top publishers.

