Chapter 13. Layouts
Contrary to what the name implies, D3 layouts do not, in fact, lay anything out for you on the screen. The layout methods have no direct visual output. Rather, D3 layouts take data that you provide and remap or otherwise transform it, thereby generating new data that is more convenient for a specific visual task. It’s still up to you to take that new data and generate visuals from it.
The list of D3 layouts includes:
-
Chord
-
Cluster
-
Force
-
Pack
-
Partition
-
Pie
-
Stack
-
Tree
-
Treemap
In this chapter, I introduce three of the most common: pie, stack, and force layouts. Each layout performs a different function, and each has its own syntax and considerations.
If you are curious about the other D3 layouts, work your way through the examples in this chapter first, to get familiar with D3’s general approach. Then check out the many examples on the D3 website, and be sure to reference the official API documentation.
Pie Layout
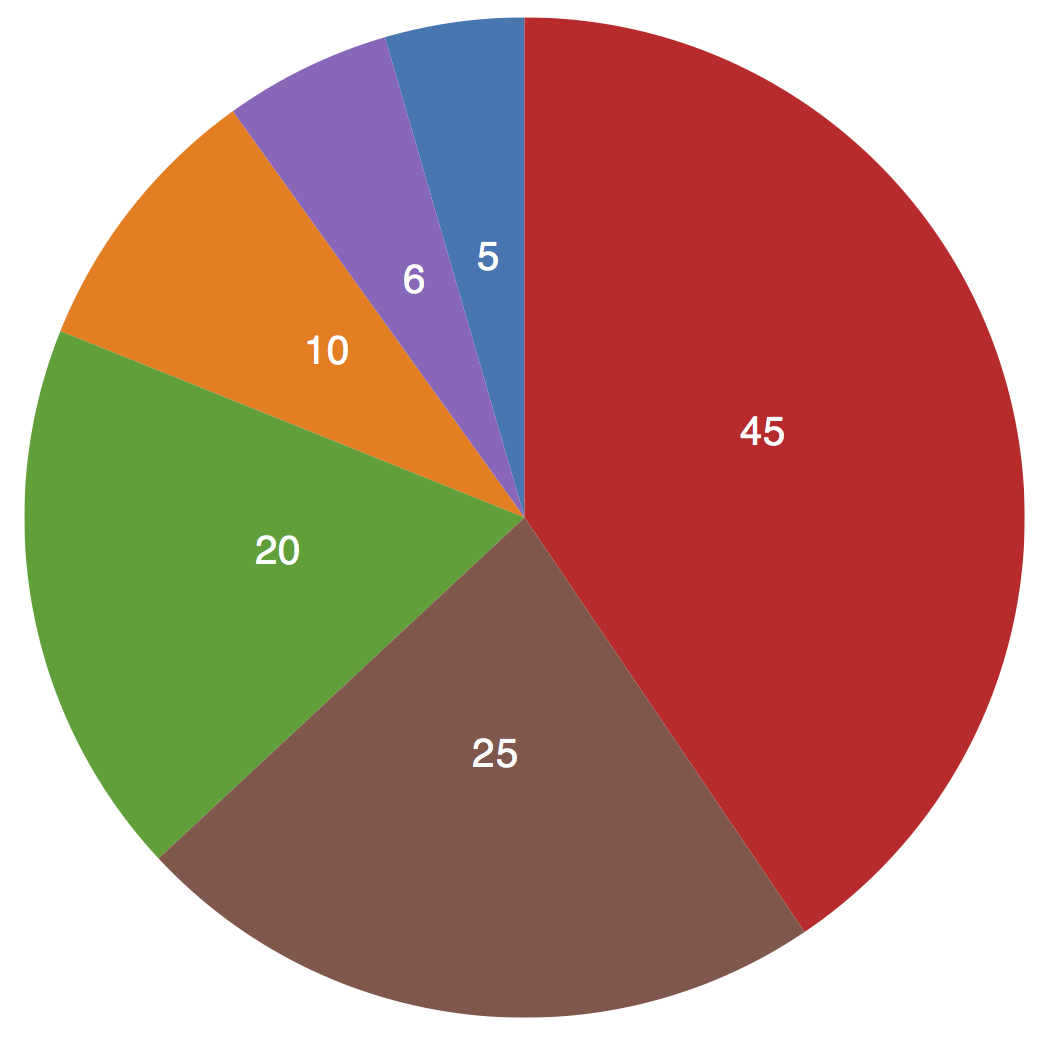
d3.pie() might not be as delicious as it sounds, but it’s still worthy of your attention. It is typically used to create a doughnut or pie chart, like the example in Figure 13-1.

Figure 13-1. A simple pie chart
Feel free to open the sample code for this in 01_pie.html and poke around.
To draw those pretty wedges, we need to know a number of measurements, including an inner and outer radius for each wedge, plus the starting and ending ...
Get Interactive Data Visualization for the Web, 2nd Edition now with the O’Reilly learning platform.
O’Reilly members experience books, live events, courses curated by job role, and more from O’Reilly and nearly 200 top publishers.

