Chapter 26. 3 Ways to Make Splendid Slope Graphs: Tip 2
How to Add a Slope Graph/Line Graph Toggle
There are times when a line graph is better for visualizing an entire trend, and others when a slope graph would be preferred to just see the overall change. Why not provide access to both options?

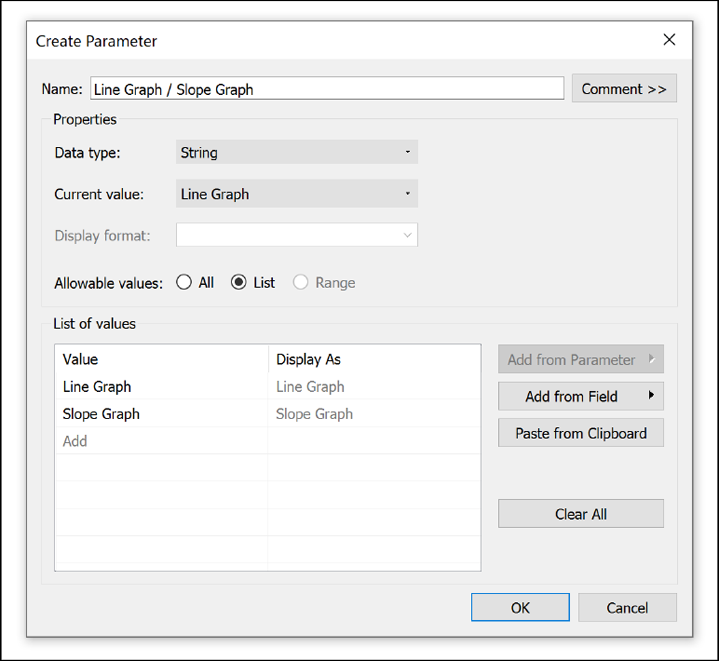
To toggle between a line graph and a slope graph, you begin by setting up a parameter with a data type of String. To set up the parameter, I like to right-click in any blank space in the Date pane and then, on the menu that opens, choose Create Parameter. Define allowable values to be Line Graph and Slope Graph:
Next, set up a calculated field that gives Tableau instructions for what to do when each of the allowable values is selected.
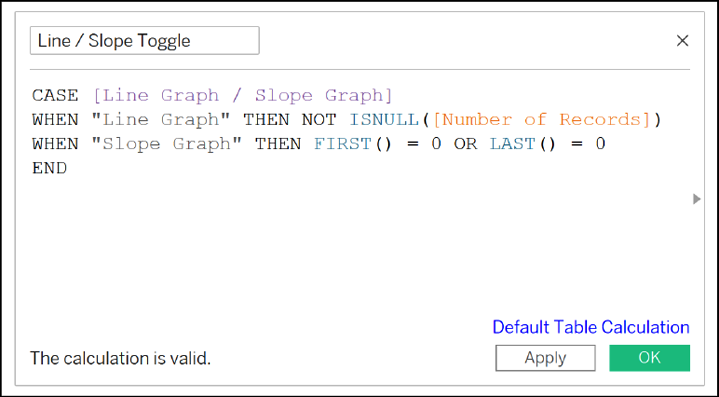
There are a few ways to write this formula, but hereâs one approach:
CASE [Line Graph / Slope Graph]
WHEN "Line Graph"
THEN NOT ISNULL([Number of Records])
WHEN "Slope Graph"
THEN FIRST() = 0 OR LAST() = 0
END

This is another Boolean formula, so we need the result to be True for the values we want to remain on the view. When Line Graph is selected, weâre saying keep the value on the view if the record is not null (i.e., everything; so, all of the marks on the line graph). When Slope Graph is selected, we are keeping only the first and last data points ...
Get Innovative Tableau now with the O’Reilly learning platform.
O’Reilly members experience books, live events, courses curated by job role, and more from O’Reilly and nearly 200 top publishers.

