Chapter 17. 3 Ways to Make Handsome Highlight Tables: Tip 2
Use Colors in Moderation
Depending on your objective or business question, it doesnât always make sense to use a full diverging color palette in a highlight table.
Notice in the highlight tables created in Chapter 16 that the colors for the values of â$25 and $212 are very challenging to differentiate. These numbers mean very different things to the businessâone cell represents profitability and the other represents a lossâyet they are both colored gray because they are in the middle of our diverging color spectrum.
You likely will have only a few cells that are easy to differentiate depending on the range of values in your highlight table. If your business question is to truly identify the highest and lowest values in the dataset, you will benefit from reading Chapter 77. Instead, I often want to know which cells contain positive values and which cells contain negative values. This would be easier to differentiate if my highlight table were limited to two colors: one for positive values and one for negative values.

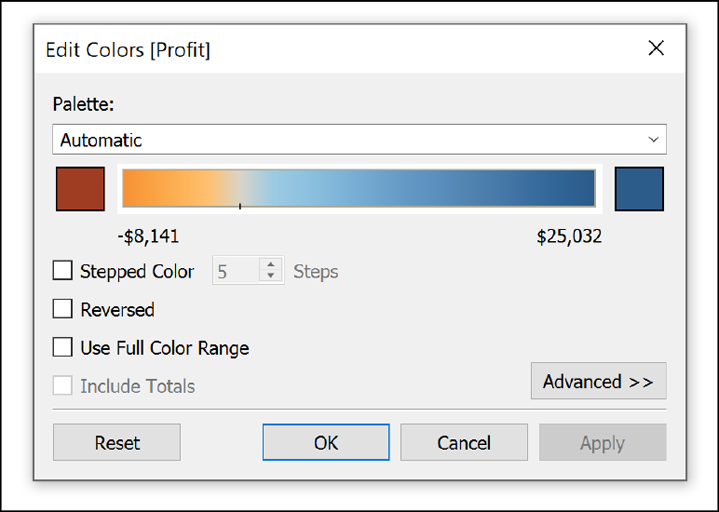
To make this change, you can either click the Colors Marks Card and then choose Edit Colors or double-click the color legend. Both paths open the Edit Colors dialog box:
Lowering the Stepped Color option to two will show one color for positive values and another color for negative values. You ...
Get Innovative Tableau now with the O’Reilly learning platform.
O’Reilly members experience books, live events, courses curated by job role, and more from O’Reilly and nearly 200 top publishers.

