Chapter 13. 3 Ways to Make Charming Crosstabs: Tip 1
Iâve explained before that a spreadsheet is not a data visualization because it does not take advantage of any preattentive attributes that will help you make sense of the data. Alas, many stakeholders continue to ask for crosstabs (text tables), either so they can do their own manipulation to the data or just because they feel more comfortable seeing the raw numbers. Well, if I have to make crosstabs, I intend to make the best dang crosstabs the world has ever seen!
Thatâs why for the first time, Iâm letting the genie out of the bottle and sharing three tips for making your text tables more effective and engaging in Tableau. Over the next three chapters, we cover how to increase the number of columns in a Tableau crosstab, how to create custom table headers, and how to align table text with precision.
Note
Related: Practical Tableau, Chapter 18, âA Spreadsheet Is Not a Data Visualizationâ (OâReilly, 2018)
How to Make Flexible Text Tables with Limitless Columns
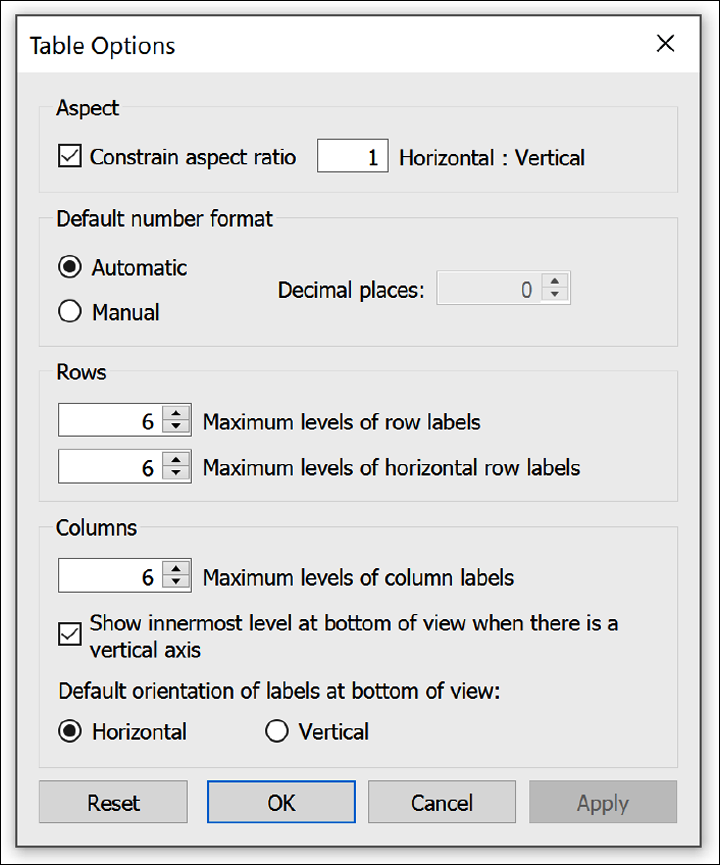
Prior to Tableau Desktop 2019.4, Tableau allowed you to create a text table with six column headers before it began concatenating dimensions.

You can easily increase this column limit to 16, though: on the menu bar at the top of the window, click Analysis > Table Layout > Advanced. This opens the Table Options dialog box in which you can change the column ...
Get Innovative Tableau now with the O’Reilly learning platform.
O’Reilly members experience books, live events, courses curated by job role, and more from O’Reilly and nearly 200 top publishers.

