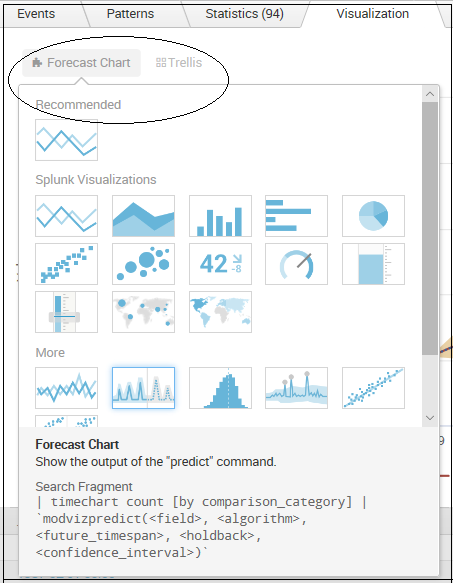
From the Visualization output panel, you can select the visualization type you'd like to use to show your data:

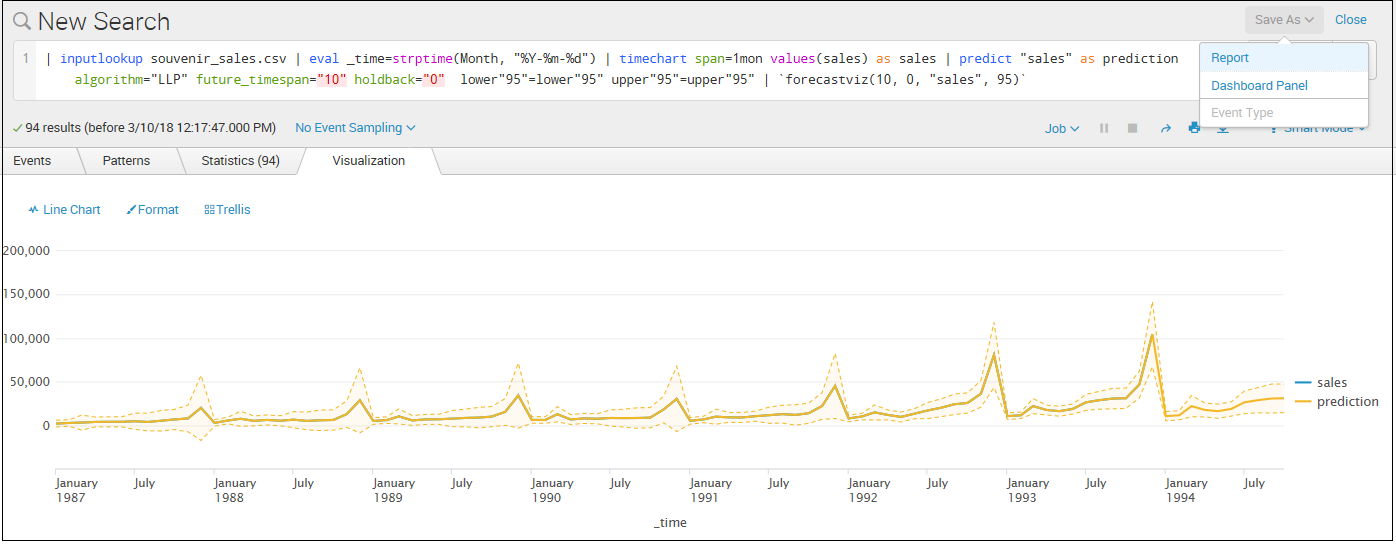
Once you have selected your desired visualization type, you can then use the Save As feature to save your visualization as a Splunk Report or Dashboard Panel:

You can use all of the visualizations you create (referred to as applying a custom visualization to your data) and save on any Splunk platform instance on which the Splunk Machine Learning Toolkit is installed.

