336 IBM TotalStorage DS6000 Series: Performance Monitoring and Tuning
Displaying the real-time data of objects and counters is sometimes not enough to identify
server performance. Logged data can provide a better understanding of the server
performance.
Alerts can be configured to notify the user or write the condition to the system event log based
on thresholds.
There are three ways to view the real-time or logged data counters:
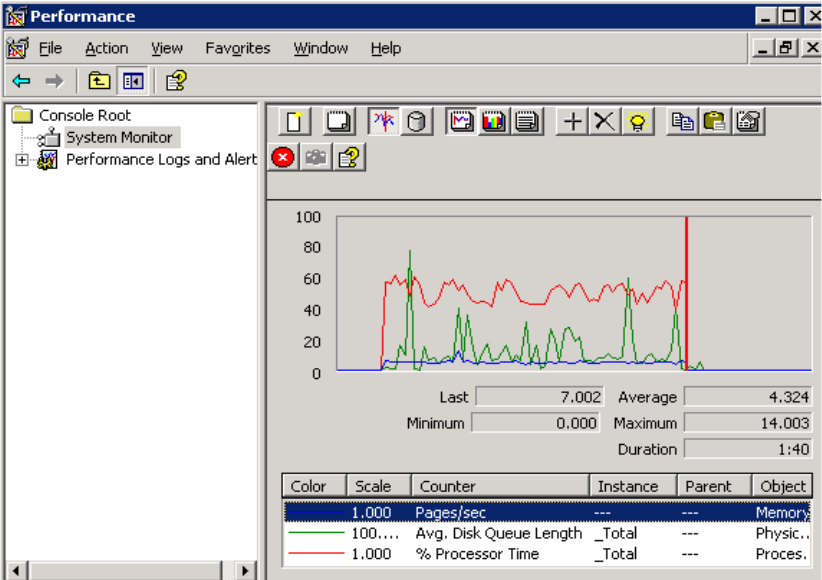
Chart
This view displays performance counters in response to real-time changes or processes
logged data to build a performance graph.
Histogram
This view displays bar graphics for performance counters in response to real-time
changes or logged performance data. It is useful for displaying peak values of the
counters.
Report
This view displays only numeric values of objects or counters. It can be used for displaying
real-time activity or displaying logged data results. It is useful for displaying many
counters.
Figure 9-15 The Performance console: System Monitor
9.6.3 Key objects and counters
Performance Monitor provides the ability to monitor many aspects of your system; however,
for our discussion we are interested mainly in I/O-related performance. Table 9-7 on page 337
describes the different I/O-related statistics that can be reported on by Performance Monitor.
Note that some of the statistics require the disk counters that are provided by diskperf.

Chapter 9. Open system servers - Windows 337
The key objects in Windows are:
Memory
Processor
Disk
Network
Tuning these key objects will greatly improve the performance of disk I/O.
Table 9-7 Performance monitoring objects
Object Counter Description
Physical disk Percent disk time The percentage of time that a
disk is busy. The general rule is
that the total percent disk time
for all logical disks should be
less than 85 percent.
Physical disks Average disk queue length The number of requests for disk
access. The general rule of
thumb is that the total average
disk queue length should be
less than or equal to three. It
may be important to note the
actual number of spindles in a
hardware RAID set and multiply
the number of spindles by the
average disk queue length.
Logical disks Avg. disk second/transfer The average number of reads
and writes I/Os per second.
Logical disks Disk bytes/second The current reads and writes
throughput per second.
Logical disks Current disk queue length The current number of requests
for access to the logical disk
device.
Cache Copy read hits The percentage of requests
found in the cache. Based on an
analysis of the user
environment the goal was to
emulate approximately an 80
percent cache hit rate.
Memory Cache bytes The amount of the cache
memory currently being used
by the system. The maximum
amount of RAM that the system
can use for caching is 512 MB.
Memory Cache bytes peak Maximum number of bytes
used by the cache at any given
time.
Get IBM TotalStorage DS6000 Series: Performance Monitoring and Tuning now with the O’Reilly learning platform.
O’Reilly members experience books, live events, courses curated by job role, and more from O’Reilly and nearly 200 top publishers.

