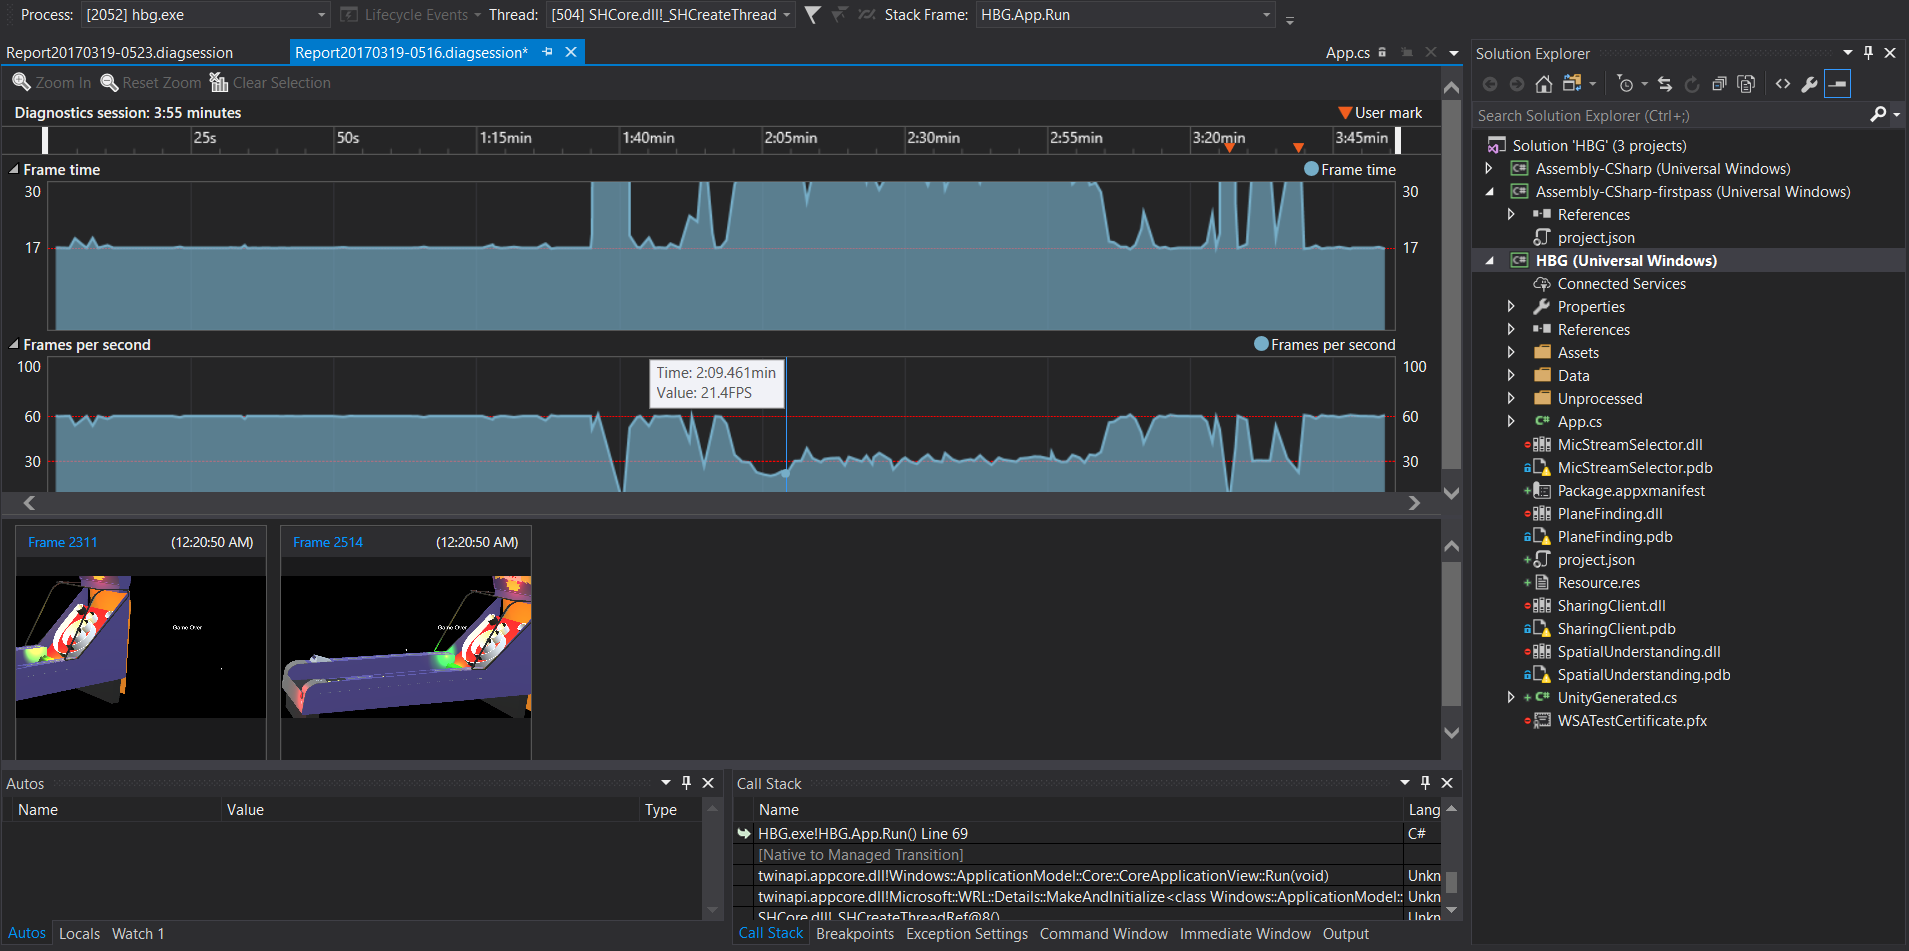
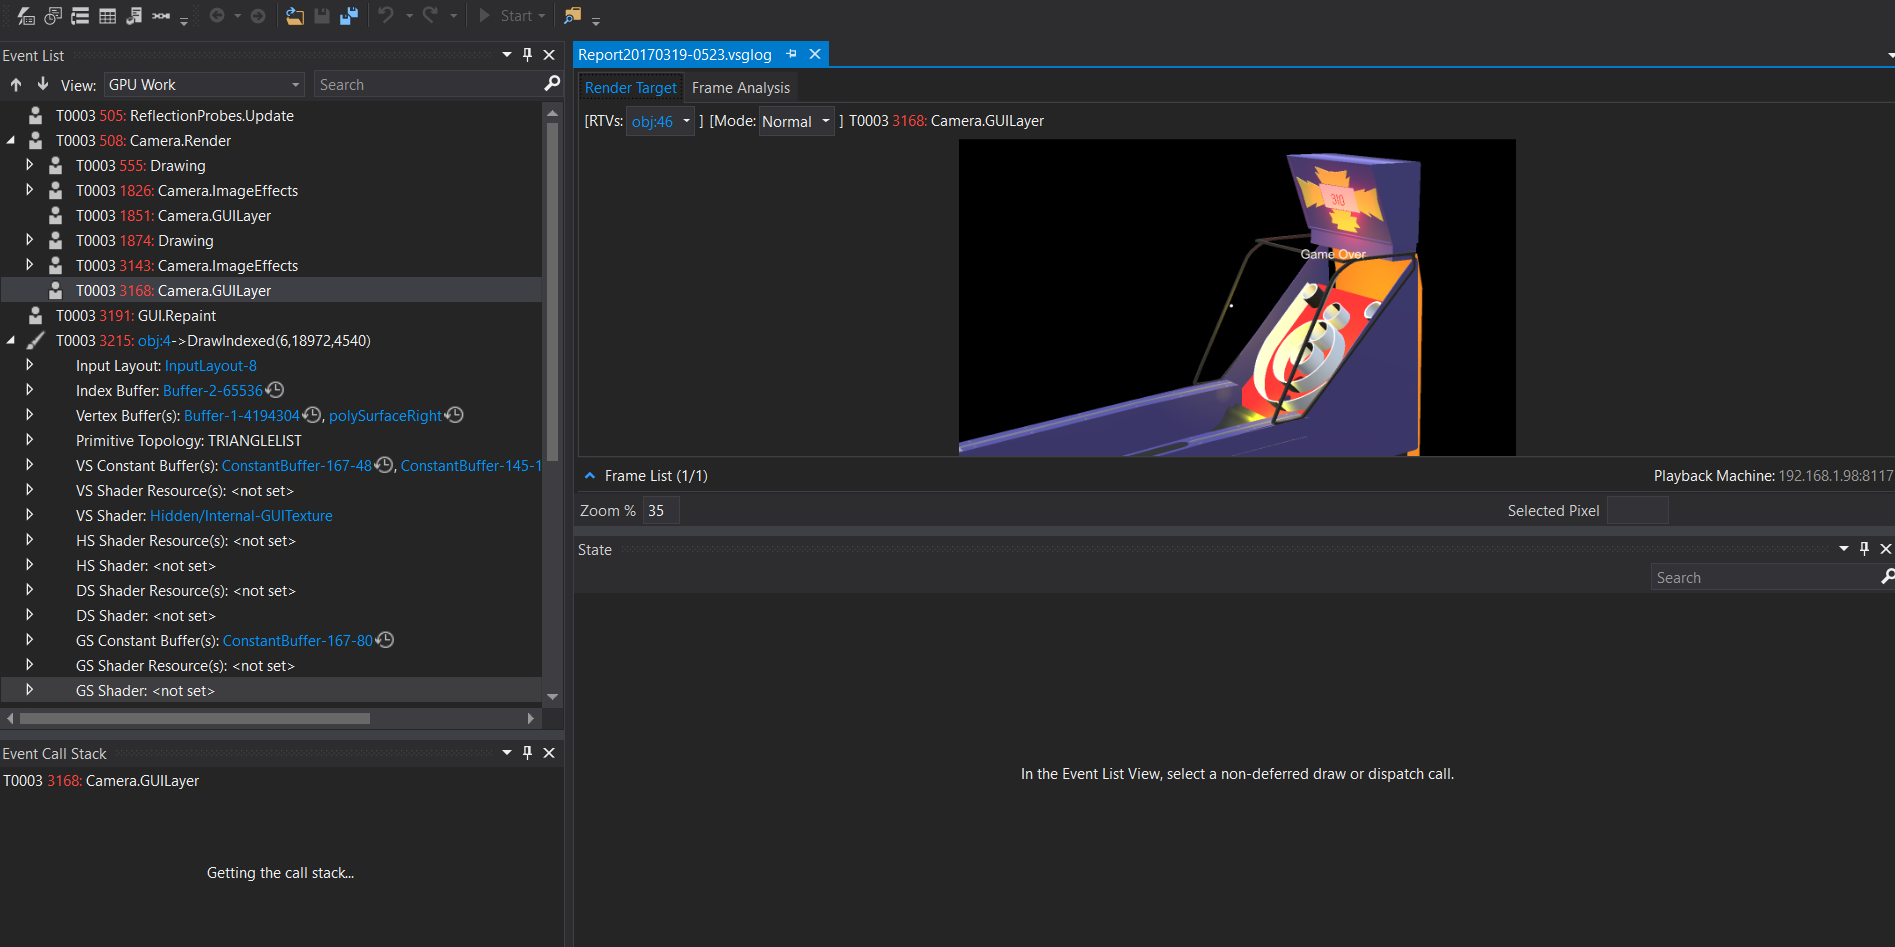
Much like the Unity Frame Debugger, this profiler then breaks down to individual frames. However, the big difference between the Unity and Microsoft versions is that this drills down to the DirectX level, which is about as low as you go without going to assembly language and machine code:
 Much like the other debuggers, you can break down the program to the various method calls to help find problems. However, this tool is designed around debugging visual problems:

You can select specific frames and break down ...

