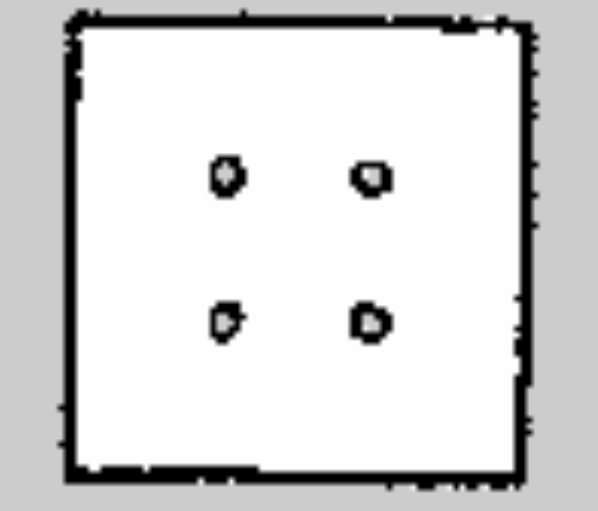
Take the example of a square room with four static obstacles inside. The following diagram shows the map generated using SLAM in ROS (you will later learn how to generate it yourself):

In such a two-dimensional map, the free areas and occupied areas are drawn in different intensities of gray in 8-bit format (0-255 range, as was already mentioned earlier when describing the costmaps). Then, the occupancy probability for each cell is obtained as the difference between 255 and the intensity value, divided by 255. This means the following:
- White areas (255 value) give a 0% probability; that is, there is no obstacle in ...

