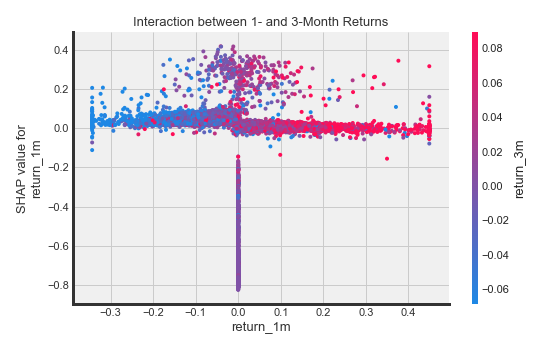
Lastly, SHAP values allow us to gain additional insights into the interaction effects between different features by separating these interactions from the main effects. The shap.dependence_plot can be defined as follows:
shap.dependence_plot("return_1m", shap_values, X_test, interaction_index=2, title='Interaction between 1- and 3-Month Returns')
It displays how different values for 1-month returns (on the x axis) affect the outcome (SHAP value on the y axis), differentiated by 3-month returns:

SHAP values provide granular feature attribution at the level of each individual prediction, and enable much richer ...

