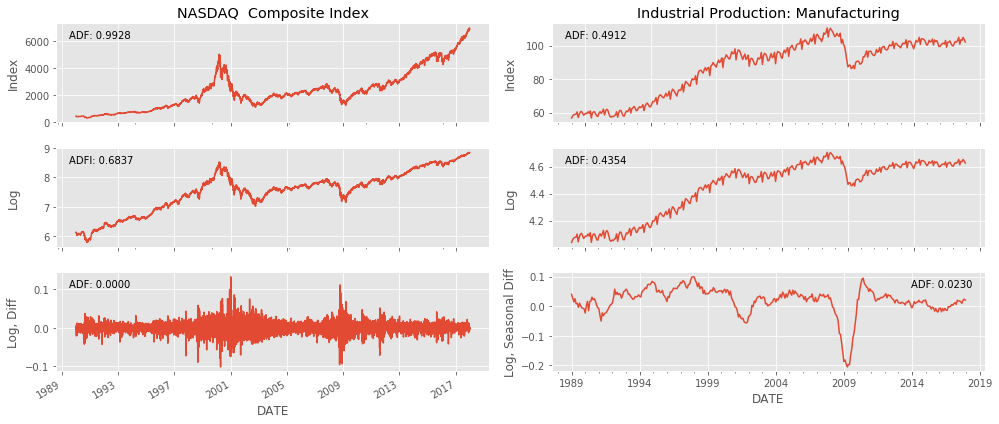
The following chart shows time series for the NASDAQ stock index and industrial production for the 30 years through 2017 in original form, as well as the transformed versions after applying the logarithm and subsequently applying first and seasonal differences (at lag 12), respectively. The charts also display the ADF p-value, which allows us to reject the hypothesis of unit-root non-stationarity after all transformations in both cases:

We can further analyze the relevant time series characteristics for the transformed series using a Q-Q plot that compares the quantiles of the distribution of the time ...

