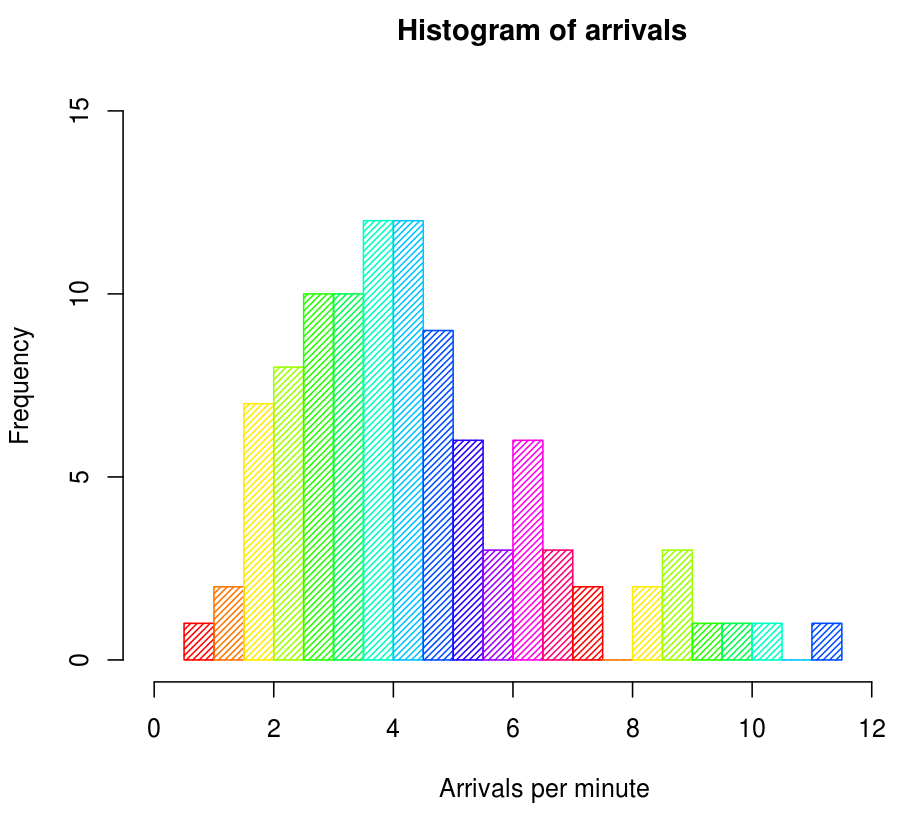
The distribution of numerical data that is accurately represented in a statistical format is called a histogram. It is basically a graphical plot, like we saw in our machine learning outputs in Chapter 10, Accelerated Machine Learning on GPUs. Histograms can be used to assess a number of parameters and estimations across diverse disciplines. Remember Karl Pearson's correlation coefficient? It was he who first introduced this concept:

The preceding diagram is an example of a histogram.

