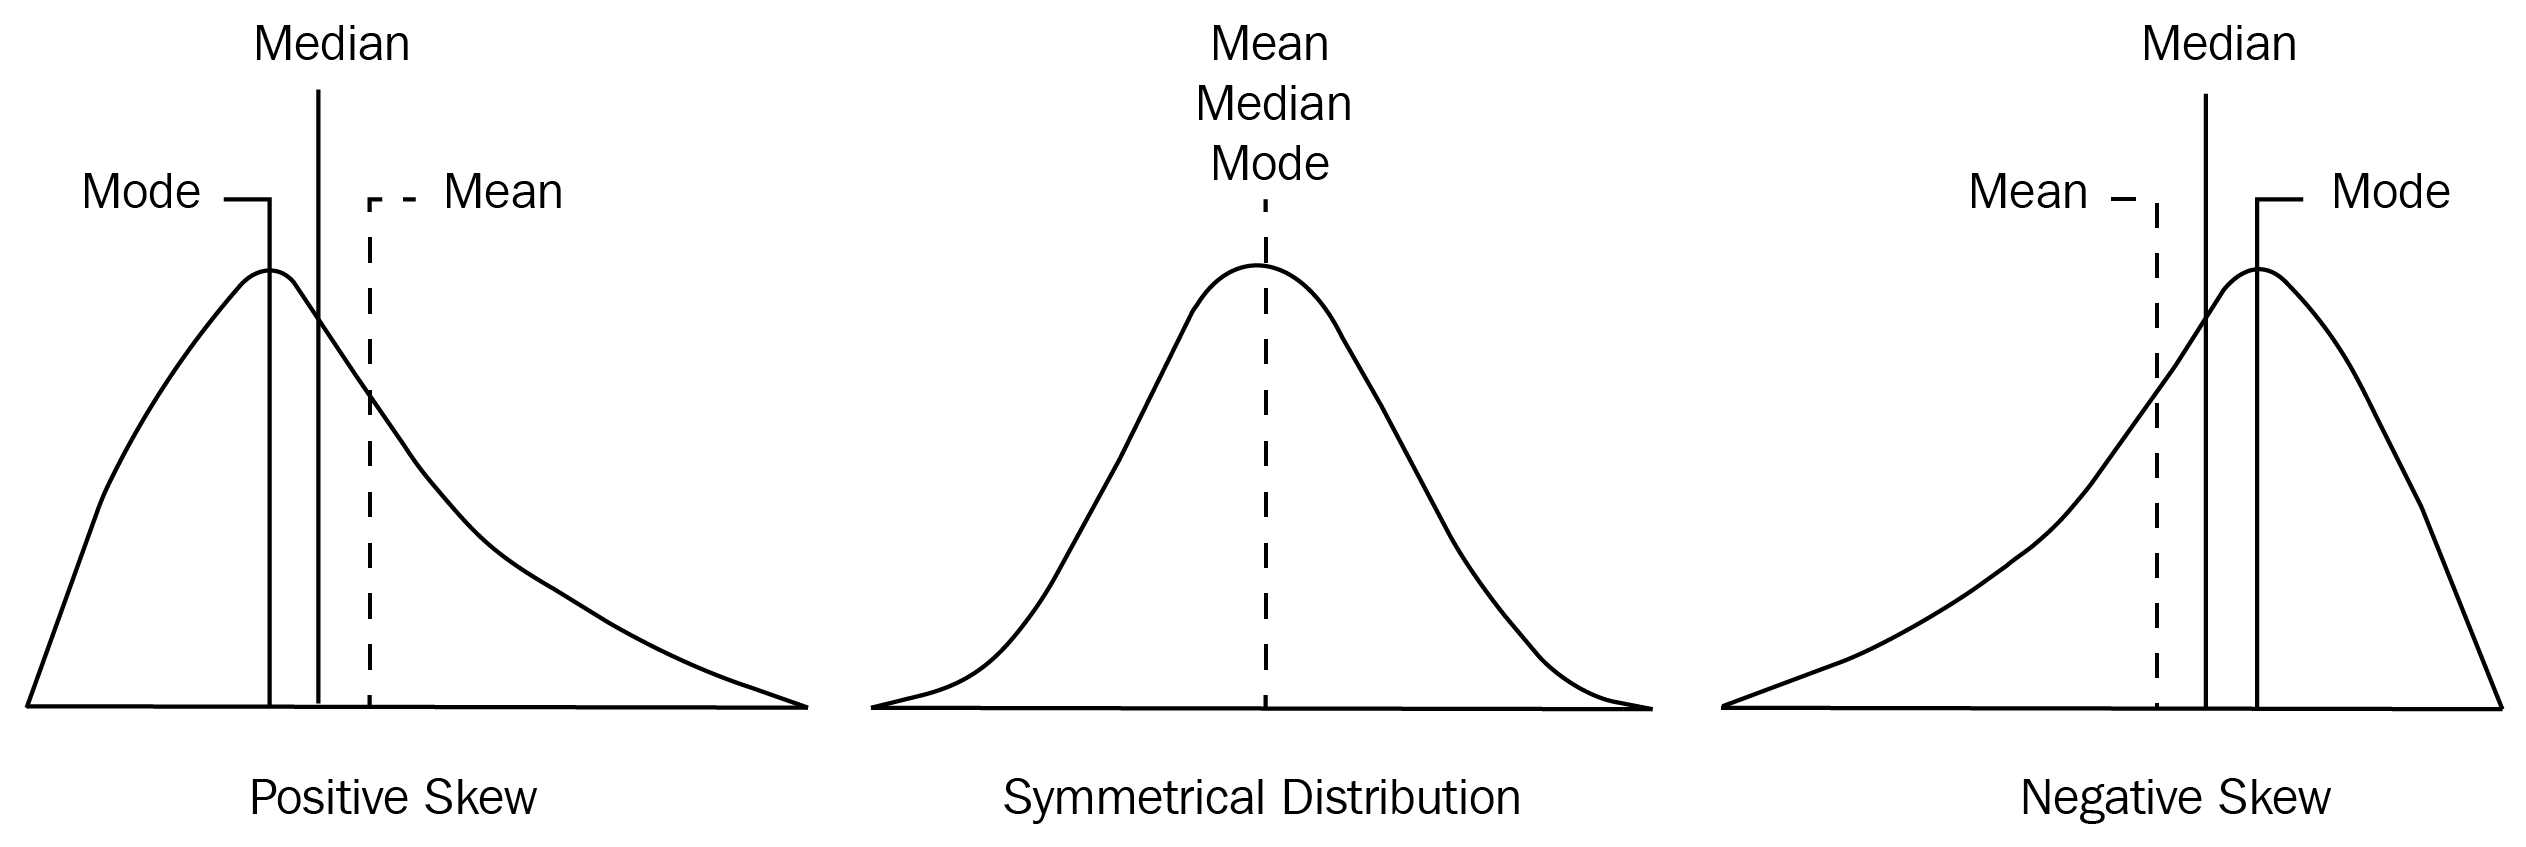
In probability theory and statistics, skewness is a measure of the asymmetry of the variable in the dataset about its mean. The skewness value can be positive or negative, or undefined. The skewness value tells us whether the data is skewed or symmetric. Here's an illustration of a positively skewed dataset, symmetrical data, and some negatively skewed data:

Note the following observations from the preceding diagram:
- The graph on the right-hand side has a tail that is longer than the tail on the right-hand side. This indicates that the distribution of the data is skewed to the left. If you select any point in the left-hand longer ...

