When you go to the Overview blade, you will see a dashboard with basic information available regarding your account:
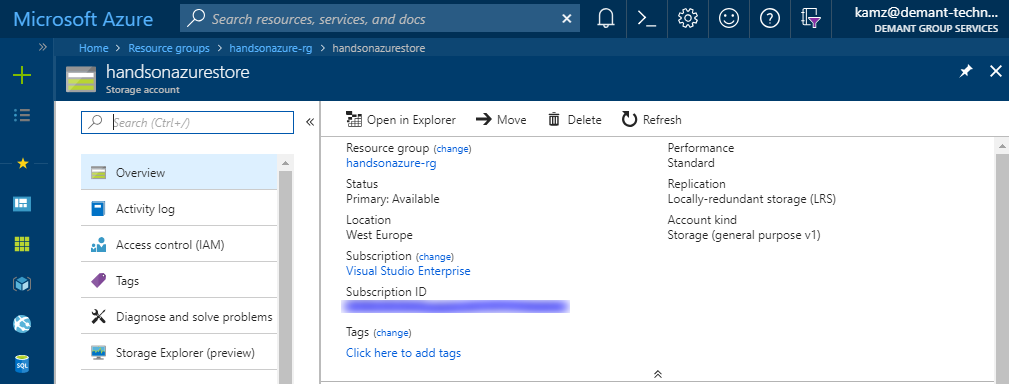
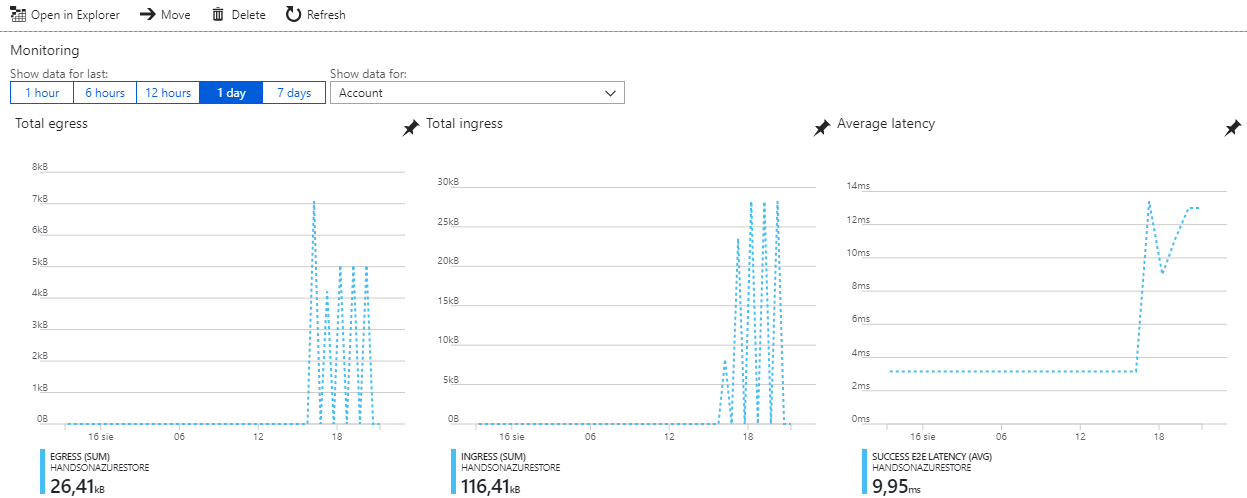
As you can see, it displays the information you defined while creating it, such as location, performance tier, or replication type. Additionally, when you scroll down, you will see the Monitoring section, where you can see how the whole service works:
In this section, we are covering Table Storage, so find the Tables blade on the left and click on it. Initially, you should see no tables at all—of course, ...

