Let's take a look at an example of a velocity chart, as follows:
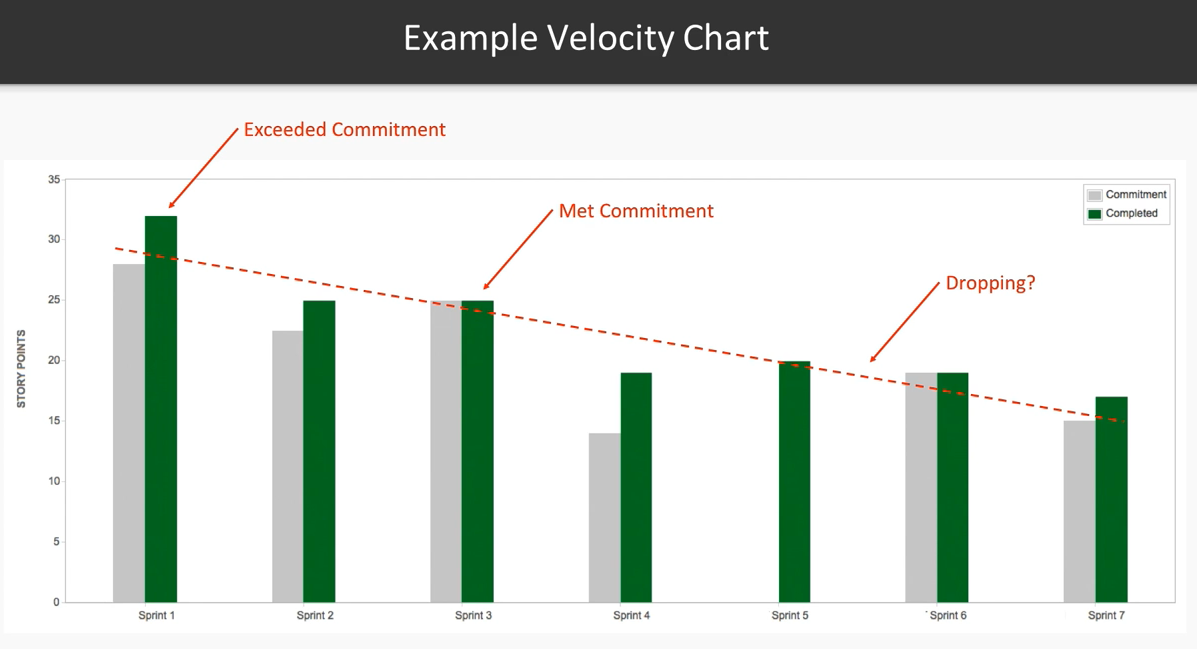
Velocity chart example
To orient us to the preceding chart, let's take a look at its different elements. The gray bars represent what we've committed to in each of our sprints, and we can see that this is measured in STORY POINTS. In this example, we can see that in Sprint 3, we've actually committed to 25 story points. The green bar represents what the team finished, and in this example, we've completed 25 story points, and we've met 100 percent of our commitment. That's great! We can also see some examples where the gray bar is lower than the green ...

