Chapter 7
The Monthly Report

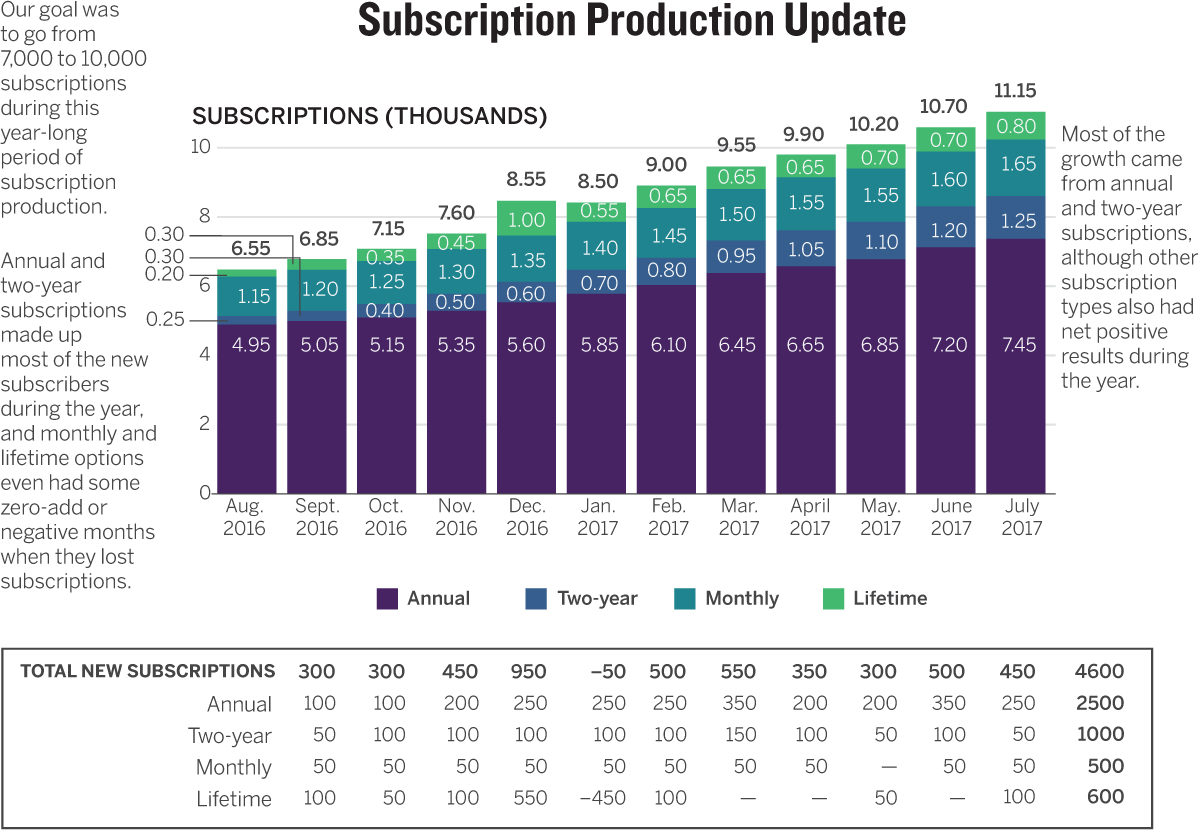
Here it is: the classic data dump. The bosses want an update on The Numbers, so that’s what the marketing manager at a podcast app company creates: a single slide showing all of them. The manager needs to update her supervisor about subscription production every month, and this is the slide she uses. The company offers four subscription options and has target goals for growth. In addition to totals by month, her boss likes to see how many of each type of subscription are added each month. Recently he complained about the chart, saying it was confusing, and annoying to deal with. Even reading it by himself on his screen, ...
Get Good Charts Workbook now with the O’Reilly learning platform.
O’Reilly members experience books, live events, courses curated by job role, and more from O’Reilly and nearly 200 top publishers.

