So let's take a look at our actual source data that we're working with. This is real weather data from the year 1800:
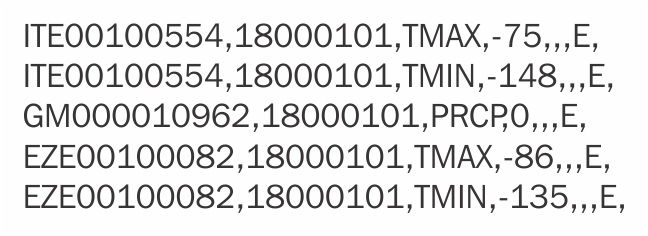
The format of our data is a comma-separated list of values on each line, where each line indicates a given observation at a given day at a given weather station. Each line starts with the weather station ID. If I remember right, ITE00100554 corresponds to Paris and EZE00100082 to Prague. The weather station ID is followed by the date, 18000101, that's in year/month/day format, 1800 January 1 in this example. Then we get the observation type, so that's TMAX, TMIN ...

