Part II
PivotTables and PivotCharts
 Head to
 www.dummies.com/extras/exceldataanalysis to find an article about handy PivotTable Tools available on the Analyze tab.
In this part …
![]() Use PivotTables to cross-tabulate data and gain new insights into your information.
Use PivotTables to cross-tabulate data and gain new insights into your information.
![]() Extend the power of Excel’s PivotTables by creating your own customized formulas.
Extend the power of Excel’s PivotTables by creating your own customized formulas.
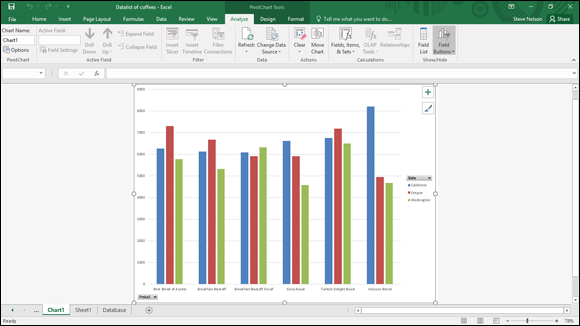
![]() Display cross-tabulated data in a chart for new perspectives on opportunities and problems.
Display cross-tabulated data in a chart for new perspectives on opportunities and problems.
![]() Customize PivotCharts to make sure your graphical information communicates the right messages.
Customize PivotCharts to make sure your graphical information communicates the right messages.
Get Excel Data Analysis For Dummies now with the O’Reilly learning platform.
O’Reilly members experience books, live events, courses curated by job role, and more from O’Reilly and nearly 200 top publishers.

