Chapter 4. DQS Model Example
This chapter will demonstrate the use of the DQS framework. This framework defines the data quality tolerances for applicable dimensions for data in data volumes, as required by business functions. The model illustrated in Figure 4-1 is presented like a manufacturing assembly line, with 11 business functions shown from left to right. This is a simple model that provides sufficient details to illustrate the DQS framework and the concept of fit-for-purpose data. Your firm is likely organized differently, with different business functions, applications, and data requirements per function. The model illustrates the DQS for a subset of data volumes intended for use by downstream consumers and does not fully illustrate all DQS requirements for every function.
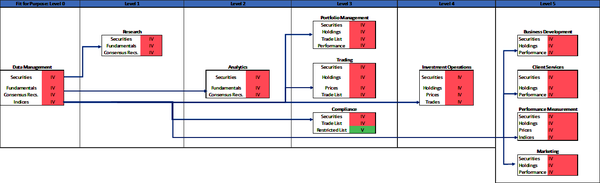
Figure 4-1. DQS model (large format, color version)
You can use this model as a template and create a similar model to reflect your business functions, data requirements, and the DQS for data volumes you use or that your business functions or applications use. You can also apply this model more broadly to data that is used by many business functions and applications across your firm.
The business functions in this model are defined as follows:
- Data Management function
- Ingests volumes of data from third-party data vendors and applies data quality validations to the data according to the DQS of downstream functions; remediates any data anomalies
- Research function
- Receives data from the Data Management function and uses the data in investment research processes
- Analytics function
- Receives data from the Data Management function and uses the data to generate security analytics data
- Portfolio Management function
- Receives data from the Data Management, Research, Analytics, and Investment Operations functions to manage portfolios
- Trading function
- Receives data from the Data Management function and uses the data to identify the securities for trading
- Compliance function
- Receives data from the Data Management function and uses the data to identify the securities that have been traded; compares to client-restricted lists
- Investment Operations function
- Receives data from the Data Management function and uses the data to identify securities and associated market data for accounting purposes
- Business Development function
- Receives data from the Data Management function and uses the data to support generation of sales presentations
- Client Services function
- Receives data from the Data Management function and uses the data to support client reporting
- Performance Measurement function
- Receives data from the Data Management function and uses the data to calculate performance returns and attributions
- Marketing function
- Receives data from the Data Management function and uses the data to generate marketing materials
Each business function is represented by a box. The box contains one or more data volumes required by the function to operate. The data quality status is indicated with a V (valid), IV (invalid), or S (suspect) based on the data quality metrics of the data volumes.
Figure 4-1 shows how the security master data is provisioned to the other downstream consumers from the Data Management function. You will see throughout the DQS model example how the application of DQS provide precise data quality measurements and metrics. The data quality metrics are used to determine if the data is fit for purpose and consumption by the business function. The fit-for-purpose level, explained later in this chapter, indicates different DQS tolerances for data used by business functions and applications. For example, a data volume containing stock prices with empty or stale values may be fit for purpose and usable for general investment research and stock market analysis, but empty prices are not fit for purpose for use by operations to calculate a portfolioâs net asset value, nor by performance measurement to precisely calculate portfolio returns.
Figure 4-2 shows the uncleansed, raw dataset that will be used by the model to generate the data quality metrics for dimensions of completeness, timeliness, accuracy, precision, and conformity. This data volume is received by the Data Management function. This function applies data quality validations to the data volume based on the DQS of downstream consumers (e.g., Research, Analytics, Portfolio Management, and Trading functions). The Data Management function uses the data quality tolerances defined in the DQS to identify and correct the data anomalies.
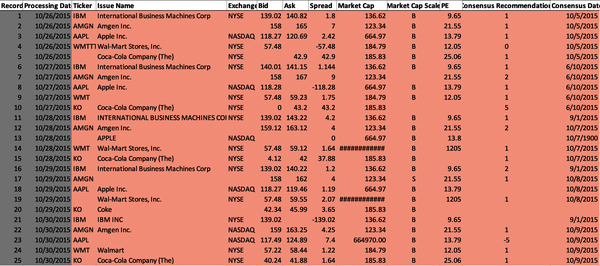
Figure 4-2. Raw security master data volume (large format, color version)
Completeness DQS
As Iâve mentioned in earlier chapters, you need to determine whether the existence of the data is mandatory or optional. Every datum has a completeness or existence dimension. This is the most basic test for any piece of data. When data elements are defined as nonnullable (cannot be empty) in physical data structures such as databases, then the technology enforces completeness for those data elements in data volumes.
The completeness DQS for all data elements in the security master data volume are the same for each downstream business function. Table 4-1 outlines the data quality tolerances for each data element, defined by the DQS and required by all downstream consumers.
| Data element | Data quality description | DQS | Business impact |
|---|---|---|---|
| Ticker | All Ticker datum values are mandatory and cannot be empty; if any are empty, then the business impact is high. | Ticker: Completeness = M, IV ⥠1, H | High |
| Issue Name | All Issue Name datum values are mandatory and cannot be empty; if any are empty, then the business impact is high. | Issue Name: Completeness = M, IV ⥠1, H | High |
| Exchange | All Exchange symbol datum values are mandatory and cannot be empty; if any are empty, then the business impact is high. | Exchange: Completeness = M, IV ⥠1, H | High |
| Bid | All Bid price datum values are mandatory and cannot be empty; if any are empty, then the business impact is high. | Bid: Completeness = M, IV ⥠1, H | High |
| Ask | All Ask price datum values are mandatory and cannot be empty; if any are empty, then the business impact is high. | Ask: Completeness = M, IV ⥠1, H | High |
| Spread | All Spread datum values are mandatory and cannot be empty; if any are empty, then the business impact is high. | Spread: Completeness = M, IV ⥠1, H | High |
| Market Cap | All Market Cap datum values are mandatory and cannot be empty; if any are empty, then the business impact is high. | Market Cap: Completeness = M, IV ⥠1, H | High |
| Market Cap Scale | All Market Cap Scale datum values are mandatory and cannot be empty; if any are empty, then the business impact is high. | Market Cap Scale: Completeness = M, IV ⥠1, H | High |
| Price to Earnings (PE) | All PE datum values are mandatory and cannot be empty; if any are empty, then the business impact is high. | PE: Completeness = M, IV ⥠1, H | High |
| Consensus Recommendation | Consensus Recommendation datum values may or may not exist for a stock of an issuer; therefore, the existence of the Consensus Recommendation is optional and business impact is low. | Consensus Recommendation: Completeness = O, S ⥠1, L | Low |
| Consensus Date | Consensus Date datum values may or may not exist for a stock of an issuer; therefore, the existence of the Consensus Date is optional and business impact is low. | Consensus Date: Completeness = O, S ⥠1, L | Low |
The model applies the completeness DQS to each datum in the security master data volume. Figure 4-3 illustrates the results and demonstrates the valid, invalid, or suspect data quality metric for each datum. The DQS indicate the Ticker, Issue Name, Exchange, Bid, Ask, Spread, Market Cap, Market Cap Scale, and PE datum values are mandatory and the data must exist. The DQS indicate the existence of Consensus Recommendation and Consensus Date datum values is optional. The model then generates the data quality metrics assigning datum values with V (valid) if the data exists, IV (invalid) if the data is empty, and S (suspect) if the data does not exist but the existence of the data is optional and not mandatory.
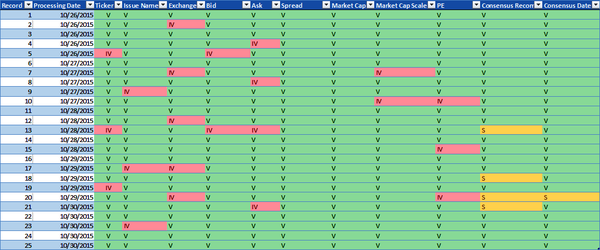
Figure 4-3. Completeness data quality metrics (large format, color version)
The application of the DQS for the completeness data dimension to the security master data volume generates both statistics and data quality metrics. The statistics for the security master data volume in Figure 4-3 are as follows:
25 datum records
11 data elements or columns (Ticker, Issue Name)
275 datum values that may or may not exist
Table 4-2 provides the total number of valid, invalid, and suspect metrics for the security master data volume.
| Data element | Valid | Invalid | Suspect |
|---|---|---|---|
| Ticker | 22 | 3 | 0 |
| Issue Name | 22 | 3 | 0 |
| Exchange | 20 | 5 | 0 |
| Bid | 23 | 2 | 0 |
| Ask | 21 | 4 | 0 |
| Spread | 25 | 0 | 0 |
| Market Cap | 25 | 0 | 0 |
| Market Cap Scale | 23 | 2 | 0 |
| Price to Earnings (PE) | 22 | 3 | 0 |
| Consensus Recommendation | 21 | 0 | 4 |
| Consensus Date | 24 | 0 | 1 |
| Metrics totals | 248 | 22 | 5 |
Timeliness DQS
The timeliness DQS are the same for each downstream business function and are defined for the Consensus Date data element in the security master data volume in this model. Table 4-3 outlines the data quality tolerances for the timeliness data dimensions of the Consensus Date data element.
| Data element | Data quality description | DQS | Business impact |
|---|---|---|---|
| Consensus Date | Consensus Date datum values may or may not exist for a stock of an issuer. If the date exists, then the Consensus Date is valid if the number of days between the Consensus Date and the Processing Date is less than 30, suspect if the number of days between the Consensus Date and the Processing Date is greater than or equal to 30 but less than 90, and invalid if the number of days is greater than or equal to 90. In all cases, the business impact is low. | Consensus Date: Timeliness = V < 30 days, 30 days ⤠S < 90, IV ⥠90, L | Low |
The model applies the timeliness DQS to the Consensus Date data element for each Consensus Date datum in the security master data volume. Figure 4-4 illustrates the results and shows the valid, invalid, or suspect data quality metric for each Consensus Date datum.
The DQS indicate the consensus date must be less than 30 days from the Processing Date to be valid, 30 days up to 90 days from the Processing Date to be suspect, and greater than or equal to 90 days from the Processing Date to be invalid. Figure 4-4 includes two new columns for illustration purposes: a copy of the Consensus Date datum values in the column named âConsensus Date2â and a column named âNumber of Days,â which represents the Consensus Date subtracted from the Processing Date. The model applies the DQS to the data volume and generates the data quality metrics illustrating Consensus Date datum values with V (valid) if the Consensus Date is less than 30 days from the Processing Date, IV (invalid) if the Consensus Date is greater than or equal to 90 days from the Processing Date, and S (suspect) if the Consensus Date is less than 90 but greater than or equal to 30 days from the Processing Date.
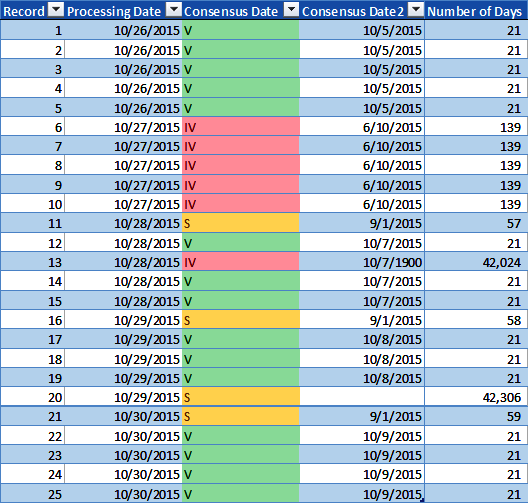
Figure 4-4. Timeliness data quality metrics (large format, color version)
Applying the DQS for the timeliness data dimension to the Consensus Date in the security master data volume generates both statistics and data quality metrics. The statistics for the security master data volume in Figure 4-4 are as follows:
25 datum records
1 data element (Consensus Date)
25 datum values
Table 4-4 shows the total number of valid, invalid, and suspect Consensus Date datum values in the security master data volume.
| Data element | Valid | Invalid | Suspect |
|---|---|---|---|
| Consensus Date | 15 | 6 | 4 |
Accuracy DQS
The accuracy DQS are the same for each downstream business function and are defined for the Ticker, Issue Name, and Exchange data elements in the security master data volume in this model. Table 4-5 outlines the data quality tolerances, as defined by the DQS, for the Ticker, Issue Name, and Exchange data elements. The official NYSE and NASDAQ security listing datasets are used by the model as authoritative sources to confirm the accuracy of the Ticker, Issue Name, and Exchange datum values in the security master data volume.
| Data element | Data quality description | DQS | Business impact |
|---|---|---|---|
| Ticker | Ticker datum values must exist for a given issue. Use the Exchange datum to select either the NYSE or NASDAQ official listing dataset and match the Ticker. If the Ticker matches a Ticker in the applicable NYSE or NASDAQ dataset, then the Ticker is valid. If the Ticker does not match a Ticker in the official listings, then the Ticker is invalid and business impact is high. | Ticker: Accuracyâ authoritative = V, Ticker = Ticker, IV, Ticker â Ticker, H | High |
| Issue Name | Issue Name datum values must exist for a given issue. Use the Exchange datum to select either the NYSE or NASDAQ official listing dataset and match the Issue Name. If the Issue Name matches an Issue Name in the applicable NYSE or NASDAQ dataset, then the Issue Name is valid. If the Issue Name does not match an Issue Name in the official listings, then the Issue Name is invalid and business impact is high. | Issue Name: Accuracyâ authoritative = V, Issue Name = Issue Name, IV, Issue Name â Issue Name, H | High |
| Exchange | Exchange datum values must exist for a given issue. The exchange is used to select the specific Exchange securities list to validate the Ticker and the Issue Name. If the Exchange is empty, then the Exchange, Ticker, and Issue Name are invalid. If the Exchange datum value matches either NYSE or NASDAQ, then the Exchange is valid. If the Exchange does not match NYSE or NASDAQ, then the Exchange is invalid and business impact is high. | Exchange: Accuracyâ authoritative = V, Exchange = NYSE or NASDAQ, IV, Exchange â NYSE or NASDAQ, H | High |
The model applies the DQS to the Ticker, Issue Name, and Exchange data elements for each datum in the security master data volume. The model uses the data illustrated in Table 4-6. This dataset is an example of an authoritative source used during accuracy validation.
| Exchange | Ticker | Issue Name |
|---|---|---|
| NASDAQ | AAPL | Apple Inc. |
| NYSE | IBM | International Business Machines Corporation |
| NASDAQ | AMGN | Amgen Inc. |
| NYSE | WMT | Walmart Inc. |
| NYSE | KO | Coca-Cola Company (The) |
The model applies the DQS to the Ticker, Issue Name, and Exchange data elements for each datum respectively in the security master data volume. Figure 4-5 illustrates the results and shows the valid, invalid, or suspect data quality metric for each datum. The DQS indicates the Ticker, Issue Name, and Exchange must match the Ticker, Issue Name, and Exchange in the official securities list to be valid. The Exchange is used to select the specific official exchange securities list to validate the Ticker and the Issue Name. If the Exchange datum is empty, then the Exchange, Ticker, and Issue Name are invalid. If any of the datum values do not match their respective data element in the official securities list, then the data is invalid.
Figure 4-5 includes three new columns for illustration purposes: a copy of the Ticker datum values in the column named âTicker2,â Issue Name datum values in the column named âIssue Name2,â and Exchange datum values in the column named âExchange2.â The model applies the DQS to the data volume and generates the data quality metrics, assigning Ticker, Issue Name, and Exchange datum values with V (valid) if they match the official securities list or IV (invalid) if they do not match the official securities list.
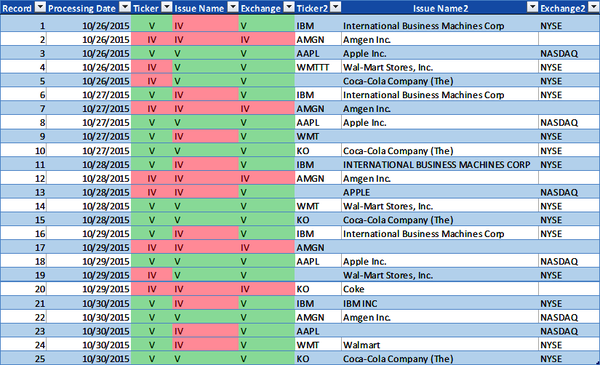
Figure 4-5. Accuracy data quality metrics (large format, color version)
Applying the DQS for the accuracy data dimension to the Ticker, Issue Name, and Exchange in the security master data volume generates both statistics and data quality metrics. The statistics for the security master data volume in Figure 4-5 are as follows:
25 datum records
3 data elements (Ticker, Issue Name, and Exchange)
75 datum values
Table 4-7 provides the total number of valid, invalid, and suspect Ticker, Issue Name, and Exchange datum values in the security master data volume.
| Data element | Valid | Invalid | Suspect |
|---|---|---|---|
| Ticker | 16 | 9 | 0 |
| Issue Name | 11 | 14 | 0 |
| Exchange | 20 | 5 | 0 |
| Metrics totals | 47 | 28 | 0 |
By using the accuracy data validation check, there are several data anomalies that can be identified in the security master data volume, including empty Exchange datums, malformed Issue Name datums, and empty or malformed Ticker datum values.
Precision DQS
The precision data dimension in this framework refers to the scale of the number that confers how precise it is. Data types such as integers are whole numbers and do not have decimals. Data types such as decimals and floating points are numbers that have decimals. When numbers with decimals are defined for data elements in physical data structures, such as databases, then the technology enables them to be stored and expressed in the data volumes. However, the physical data element definition of decimal or floating point does not enforce an explicit number of decimals. Instead, the data type definitions for these numeric data types in the physical technology allow a maximum number of decimals to be stored. Decimal data types define a specific, maximum number of decimals. Therefore, if the DQS require five decimals and the data type is defined with two decimals, then you will lose precision (dropped decimal values) when storing a five-decimal number in a two-decimal physical data typed structure. Floating point data types present a different challenge. Numbers with decimals resulting from calculations that are stored in floating point data type structures do not have an exact binary representation at the compute level. The implications can be inaccurate representation of the number as a stored value, thus potential loss of precision, potential mismatch of floating point numbers to other numeric data types, and the results of calculations may yield extraneous decimals (which, when used in combinatorial or compounding calculations may yield highly inaccurate results). This means if your DQS require a specific number of decimals, then you need to validate the precision using a validation check.
Warning
As mentioned in Chapter 3, precision and precision misalignment are often overlooked due to the complexities of storing and processing numbers using diverse data structures in databases with data typed columns and data type objects in programming languages. You need to ensure the precision required in the DQS for a consumer or application is consistent throughout the data structures and data processing applications.
The precision DQS are the same for each downstream business function and are defined for the Bid, Ask, Spread, and PE data elements in the security master data volume in this model. Table 4-8 outlines the data quality tolerances for the Bid, Ask, Spread, and PE data elements.
| Data element | Data quality description | DQS | Business impact |
|---|---|---|---|
| Bid | All Bid price datum values are mandatory. If the Bid price datum is empty or a negative number, then it is invalid. If the decimal is missing, then it is suspect. If the number of decimals is greater than or equal to one, then it is valid, and business impact is high. | Bid: Precisionâdecimal = V ⥠1, S = 0, IV = negative, H | High |
| Ask | All Ask price datum values are mandatory. If the Ask price datum is empty or a negative number, then it is invalid. If the decimal is missing, then it is suspect. If the number of decimals is greater than or equal to one, then it is valid, and business impact is high. | Ask: Precisionâdecimal = V ⥠1, S = 0, IV = negative, H | High |
| Spread | All Spread datum values are mandatory. If the Spread datum is empty or a negative number, then it is invalid. If the decimal is missing, then it is suspect. If the number of decimals is greater than or equal to one, then it is valid, and business impact is high. | Spread: Precisionâ decimal = V ⥠1, S = 0, IV = negative, H | High |
| Price to Earnings (PE) | All PE datum values are mandatory. If the PE datum is empty or a negative number, then it is invalid. If the decimal is missing, then it is suspect. If the number of decimals is greater than or equal to one, then it is valid, and business impact is high. | PE: Precisionâdecimal = V ⥠1, S = 0, IV = negative, H | High |
The model applies the precision DQS to the Bid, Ask, Spread, and PE data elements for each datum in the security master data volume. Figure 4-6 illustrates the results and shows the valid, invalid, or suspect data quality metric for each Bid, Ask, Spread, and PE datum.
The DQS indicate the precision of the Bid, Ask, Spread, and PE datum values is based on the following: datum values must have one or more decimals to be valid, missing decimals are suspect, and negative numbers are invalid. Figure 4-6 includes four new columns for illustration purposes: one copy each of the Bid, Ask, Spread, and PE datum values in the columns named âBid2,â âAsk2,â âSpread2,â and âPE2.â The model applies the DQS to the data volume and generates the data quality metrics illustrating the datum values with V (valid) if the numbers exist, are not negative numbers, and have one or more decimals; S (suspect) if the numbers exist, are not negative, and lack a decimal; and IV (invalid) if the numbers either do not exist or are negative numbers.
The application of the DQS for the precision data dimension to the Bid, Ask, Spread, and PE in the security master data volume generates both statistics and data quality metrics. The statistics for the security master data volume in Figure 4-6 are as follows:
25 datum records
4 data elements (Bid, Ask, Spread, and PE)
100 datum values
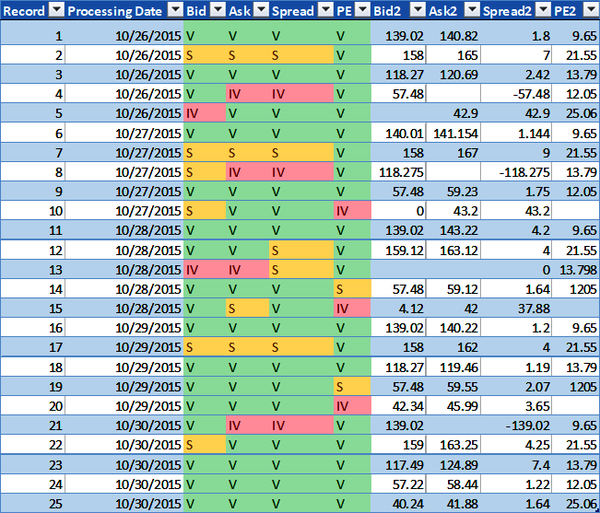
Figure 4-6. Precision data quality metrics (large format, color version)
Table 4-9 shows the total number of valid, invalid, and suspect Bid, Ask, Spread, and PE datum values in the security master data volume.
| Data element | Valid | Invalid | Suspect |
|---|---|---|---|
| Bid | 17 | 2 | 6 |
| Ask | 17 | 4 | 4 |
| Spread | 17 | 3 | 5 |
| PE | 20 | 3 | 2 |
| Metrics totals | 71 | 12 | 17 |
The precision data dimension for the Bid, Ask, Spread, and PE datum values validates the data exists and is not a negative number, and counts the number of decimals according to the DQS. By using the precision validation check, several data anomaliesâincluding empty Bid, Ask, and PE datum values, missing decimals, and negative Spread datum valuesâcan be identified in the security master data volume.
Conformity DQS
The conformity DQS are the same for each downstream business function and are defined for the Issue Name, Market Cap Scale, and the Consensus Recommendation data elements in the security master data volume in this model. Data types such as dates, timestamps, and date-times have specific formats. When these data types are defined for data elements in physical data structures, such as databases, then the technology enforces conformity for those data elements in the data volumes. Table 4-10 outlines the data quality tolerances for the Issue Name, Market Cap Scale, and Consensus Recommendation data elements.
| Data element | Data quality description | DQS | Business impact |
|---|---|---|---|
| Issue Name | All Issue Name datum values are mandatory and must be in proper case. If the Issue Name is empty or is entirely in uppercase or lowercase letters, then it is invalid, and business impact is high. | Issue Name: Conformityâletter case = V = proper case, IV = empty or uppercase or lowercase, H | High |
| Market Cap Scale | All Market Cap Scale datum values are mandatory and must be either uppercase B (that represents billion) or uppercase M (that represents million). If the Market Cap Scale is empty or any value other than uppercase B or uppercase M, then it is invalid, and business impact is high. | Market Cap Scale: Conformity = V = B or M, IV â B or M, H | High |
| Consensus Recommendation | Consensus Recommendation datum values are optional and must be a number between negative three and three. If the Consensus Recommendation is empty, then it is suspect. If the Consensus Recommendation is any number less than negative three or greater than three, then it is invalid, and business impact is low. | Consensus Recommendation: Conformity = V ⥠-3 and ⤠3, S = empty, IV < -3 and > 3, L | Low |
The model applies the conformity DQS to the Issue Name, Market Cap, and Consensus Recommendation data elements for each datum in the security master data volume. Figure 4-7 illustrates the results and shows the valid, invalid, or suspect data quality metric for each Issue Name, Market Cap, and Consensus Recommendation datum.
The conformity DQS for Issue Name indicate the Issue Name datum values must be in proper case to be valid. Otherwise, if the datum values are empty or are in lowercase or uppercase letters, then they are invalid. The conformity DQS for Market Cap Scale indicate the Market Cap Scale datum values must be either B (billion) or M (million) to be valid. Otherwise, if the datum values are empty or are any other value, then they are invalid. The conformity DQS for Consensus Recommendation indicate the Consensus Recommendation datum values are optional and must be a number equal to or greater than -3 and less than or equal to 3 to be valid. Otherwise, if the datum values are empty or are any number less than -3 or greater than 3, then they are invalid. Figure 4-7 includes three new columns for illustration purposes: a copy each of the Issue Name, Market Cap, and Consensus Recommendation datum values in the columns named âIssue Name2,â âMarket Cap Scale2,â and âConsensus Recommendation2.â
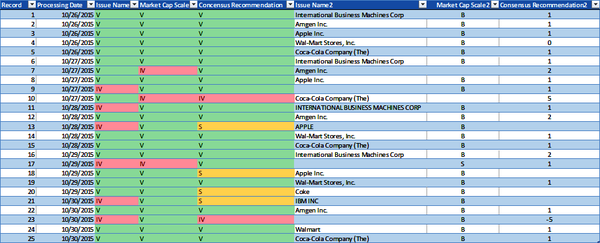
Figure 4-7. Conformity data quality metrics (large format, color version)
The model applies the DQS to the data volume and generates the data quality metrics, assigning some datum values with V (valid), which means:
The Issue Name datum exists and is in proper case
The Market Cap Scale datum exists and is either uppercase B or uppercase M
If the Consensus Recommendation datum exists, then the datum value is a number equal to or greater than -3 and less than or equal to 3
The model assigns S (suspect) only to the Consensus Recommendation datum values and indicates if the datum value does not exist.
The model assigns some datum values with IV (invalid), which means:
The Issue Name datum does not exist or is not in proper case
The Market Cap Scale datum does not exist or is not an uppercase B or an uppercase M
If the Consensus Recommendation datum exists, then the datum value is not a number equal to or greater than -3 and less than or equal to 3
Applying the DQS for the conformity data dimension to the Issue Name, Market Cap Scale, and Consensus Recommendation in the security master data volume generates both statistics and data quality metrics. The statistics for the security master data volume in Figure 4-7 are as follows:
25 datum records
3 data elements (Issue Name, Market Cap Scale, and Consensus Recommendation)
75 datum values
Table 4-11 provides the total number of valid, invalid, and suspect Issue Name, Market Cap Scale, and Consensus Recommendation datum values in the security master data volume.
| Data element | Valid | Invalid | Suspect |
|---|---|---|---|
| Issue Name | 19 | 6 | 0 |
| Market Cap Scale | 22 | 3 | 0 |
| Consensus Recommendation | 19 | 2 | 4 |
| Metrics totals | 60 | 11 | 4 |
The conformity data dimension for the Issue Name, Market Cap Scale, and Consensus Recommendation datum values is specific to each of the data elements. Therefore, the validation logic for each data element defined in the DQS is also specific to the data element.
By using the conformity data validation checks, several data anomaliesâincluding empty Issue Name and Market Cap Scale datum values, malformed Issue Name datum values (e.g., values that appear in all uppercase letters), and invalid Market Cap Scale and Consensus Recommendation datum valuesâare identified in the security master data volume.
Congruence DQS
Chapter 3 introduced three types of congruence data quality checks: prior value comparison, comparison to average, and comparison to standard deviation z-score. As mentioned, I encourage you to develop your own congruence validation checks using more sophisticated logic that may be more applicable to the data you use.
Figure 4-8 shows 10 business days of cleansed Bid, Ask, and Spread data. The data volume has been validated using the DQS, and data validations have been applied to the data elements for completeness, timeliness, accuracy, precision, and conformity. The model uses this data to demonstrate the congruence DQS.
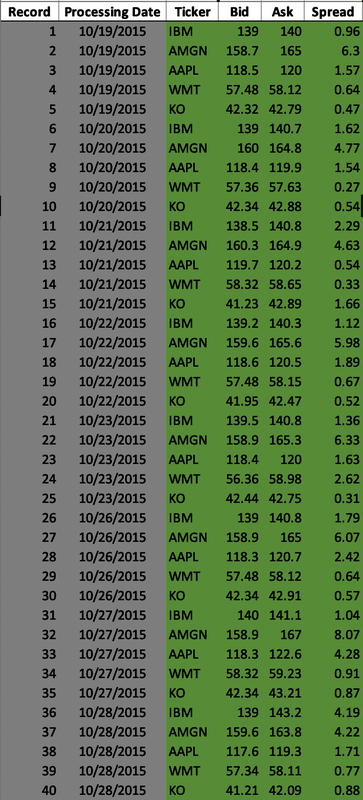
Figure 4-8. Extended security master data volume (large format, color version)
The model applies the congruence DQS outlined in Table 4-12 to the uncleansed, raw market data illustrated in Figure 4-9.
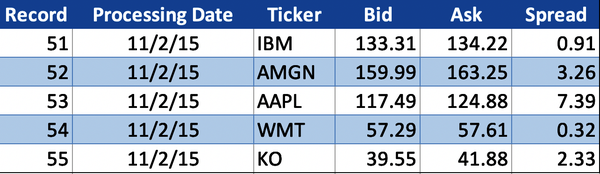
Figure 4-9. Raw market data
The congruence DQS are the same for each downstream business function and are defined for the Bid, Ask, and Spread data elements in the security master data volume. Table 4-12 outlines the data quality tolerances for the Bid price, Ask price, and Spread data elementsâthese elements are all specific to a given stock. For example, the raw Bid price for Apple (AAPL) in Figure 4-9 with Processing Date 11/2/2015 is $117.49, and the historical Bid prices for Apple (illustrated in Figure 4-8) are $118.45, $118.35, and so on. The historical Bid prices for Apple are used to validate the raw Apple Bid price in the congruence z-score data quality validation.
| Data element | Data quality description | DQS | Business impact |
|---|---|---|---|
| Bid | All Bid price datum values are mandatory and historical Bid price sample range is 10 business days. If the z-score of the Bid price is equal to or less than three, then it is valid. If the Bid price z-score is greater than three but less than four, then it is suspect. If the Bid price z-score is equal to or greater than four, then it is invalid. In all cases, the business impact is high. | Bid: Congruence z-score = range 10 business days, V ⤠3, S > 3 and < 4, H, IV ⥠4, H | High |
| Ask | All Ask price datum values are mandatory and historical Ask price sample range is 10 business days. If the z-score of the Ask price is equal to or less than three, then it is valid. If the Ask price z-score is greater than three but less than four, then it is suspect. If the Ask price z-score is equal to or greater than four, then it is invalid. In all cases, the business impact is high. | Ask: Congruence z-score = range 10 business days, V ⤠3, S > 3 and < 4, H, IV ⥠4, H | High |
| Spread | All Spread datum values are mandatory and historical Spread sample range is 10 business days. If the z-score of the Spread is equal to or less than three, then it is valid. If the Spread z-score is greater than three but less than four, then it is suspect. If the Spread z-score is equal to or greater than four, then it is invalid. In all cases, the business impact is high. | Spread: Congruence z-score = range 10 business days, V ⤠3, S > 3 and < 4, H, IV ⥠4, H | High |
The model applies the congruence DQS to the raw Bid, Ask, and Spread data elements for each datum in the raw market data volume. Tables 4-13 through 4-15 show the calculation statistics from the congruence z-score calculations.
| Processing date | Ticker | Bid | Mean bid (prior 10 days) | Bid standard deviation | Bid z-score |
|---|---|---|---|---|---|
| 11/2/2015 | AAPL | 117.49 | 118.32 | 0.5646 | 1.48 |
| 11/2/2015 | AMGN | 159.99 | 159.38 | 0.5329 | 1.15 |
| 11/2/2015 | IBM | 133.31 | 139.13 | 0.3695 | 15.75 |
| 11/2/2015 | KO | 39.55 | 41.88 | 0.7014 | 3.31 |
| 11/2/2015 | WMT | 57.29 | 57.48 | 0.5260 | 0.37 |
| Processing date | Ticker | Ask | Mean ask (prior 10 days) | Ask standard deviation | Ask z-score |
|---|---|---|---|---|---|
| 11/2/2015 | AAPL | 124.88 | 120.74 | 1.6289 | 2.54 |
| 11/2/2015 | AMGN | 163.25 | 164.74 | 1.1178 | 1.34 |
| 11/2/2015 | IBM | 134.22 | 141.08 | 1.0511 | 6.53 |
| 11/2/2015 | KO | 41.88 | 42.74 | 0.4692 | 1.84 |
| 11/2/2015 | WMT | 57.61 | 58.50 | 0.5668 | 1.57 |
| Processing date | Ticker | Spread | Mean spread (prior 10 days) | Spread standard deviation | Spread z-score |
|---|---|---|---|---|---|
| 11/2/2015 | AAPL | 7.39 | 2.41 | 1.9030 | 2.62 |
| 11/2/2015 | AMGN | 3.26 | 5.37 | 1.3561 | 1.55 |
| 11/2/2015 | IBM | 0.91 | 1.95 | 1.1270 | 0.93 |
| 11/2/2015 | KO | 2.33 | 0.87 | 0.4620 | 3.16 |
| 11/2/2015 | WMT | 0.32 | 1.01 | 0.7230 | 0.96 |
Figure 4-10 illustrates the results and shows the valid, invalid, or suspect data quality metric for each raw Bid price, Ask price, and Spread datum.
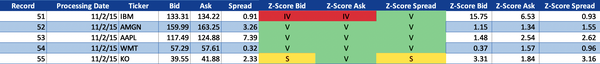
Figure 4-10. Congruence z-score data quality metrics (large format, color version)
The model applies the DQS to the raw data volume, using the historical data volume as reference, and generates the data quality metrics assigning the datum values with V (valid) if the z-score for the Bid, Ask, are Spread datum is equal to or less than three standard deviations from the mean; S (suspect) if the z-score for the Bid, Ask, or Spread datum is greater than three but less than four standard deviations from the mean; and IV (invalid) if the z-score for the Bid, Ask, or Spread datum is equal to or greater than four standard deviations from the mean. Figure 4-10 includes the z-scores for the raw Bid, Ask, and Spread datum values for illustration purposes.
The valid data quality metrics, shown in Figure 4-10, are as follows:
The raw Bid price of $159.99 for Amgen (AMGN) on 11/2/2015 with a z-score of 1.15 is 1.15 standard deviations from the mean Bid price of $159.38 that is the average Amgen Bid price for the prior 10 days.
The raw Bid price of $117.49 for Apple (AAPL) on 11/2/2015 with a z-score of 1.48 is 1.48 standard deviations from the mean Bid price of $118.32 that is the average Apple Bid price for the prior 10 days.
The raw Bid price of $57.29 for Walmart (WMT) on 11/2/2015 with a z-score of 0.37 is 0.37 standard deviations from the mean Bid price of $57.48 that is the average Walmart Bid price for the prior 10 days.
The raw Ask price of $163.25 for Amgen (AMGN) on 11/2/2015 with a z-score of 1.34 is 1.34 standard deviations from the mean Ask price of $164.74 that is the average Amgen Ask price for the prior 10 days.
The raw Ask price of $124.88 for Apple (AAPL) on 11/2/2015 with a z-score of 2.54 is 2.54 standard deviations from the mean Ask price of $120.74 that is the average Apple Ask price for the prior ten days.
The raw Ask price of $57.61 for Walmart (WMT) on 11/2/2015 with a z-score of 1.57 is 1.57 standard deviations from the mean Ask price of $58.50 that is the average Walmart Ask price for the prior 10 days.
The raw Ask price of $41.88 for Coca-Cola (KO) on 11/2/2015 with a z-score of 1.84 is 1.84 standard deviations from the mean Ask price of $42.74 that is the average Coca-Cola Ask price for the prior 10 days.
The raw Spread of $0.91 for International Business Machines (IBM) on 11/2/2015 with a z-score of 0.93 is 0.93 standard deviations from the mean Spread of $1.95 that is the average IBM Spread for the prior 10 days.
The raw Spread of $3.26 for Amgen (AMGN) on 11/2/2015 with a z-score of 1.55 is 1.55 standard deviations from the mean Spread of $5.37 that is the average Amgen Spread for the prior 10 days.
The raw Spread of $7.39 for Apple (AAPL) on 11/2/2015 with a z-score of 2.62 is 2.62 standard deviations from the mean Spread of $2.41 that is the average Apple Spread for the prior 10 days.
The raw Spread of $0.32 for Walmart (WMT) on 11/2/2015 with a z-score of 0.96 is 0.96 standard deviations from the mean Spread of $1.01 that is the average Walmart Spread for the prior 10 days.
The suspect data quality metrics, as shown in Figure 4-10, are as follows:
The raw Bid price of $39.55 for Coca-Cola (KO) on 11/2/2015 with a z-score of 3.31 is 3.31 standard deviations from the mean Bid price of $41.88 that is the average Coca-Cola Bid price for the prior 10 days.
The raw Spread of $2.33 for Coca-Cola (KO) on 11/2/2015 with a z-score of 3.16 is 3.16 standard deviations from the mean Spread of $0.87 that is the average Coca-Cola Spread for the prior 10 days.
The invalid data quality metrics, as shown in Figure 4-10, are as follows:
The raw Bid price of $133.31 for International Business Machines (IBM) on 11/2/2015 with a z-score of 15.75 is 15.75 standard deviations from the mean Bid price of $139.13 that is the average IBM Bid price for the prior 10 days.
The raw Ask price of $134.22 for International Business Machines (IBM) on 11/2/2015 with a z-score of 6.53 is 6.53 standard deviations from the mean Ask price of $141.08 that is the average IBM Ask price for the prior 10 days.
Applying the DQS for the congruence data dimension to the Bid, Ask, and Spread datum values in the raw market data volume generates both statistics and data quality metrics. The statistics for the raw market data volume in Figure 4-10 are as follows:
5 datum records
3 data elements (Bid, Ask, and Spread)
15 datum values
Table 4-16 shows the total number of valid, invalid, and suspect Bid, Ask, and Spread datum values in the raw market data volume.
| Data element | Valid | Invalid | Suspect |
|---|---|---|---|
| Bid | 3 | 1 | 1 |
| Ask | 4 | 1 | 0 |
| Spread | 4 | 0 | 1 |
| Metrics totals | 11 | 2 | 2 |
The DQS for the congruence data dimension for Bid, Ask, and Spread datum values are specific to the stock (e.g., Apple, Walmart) and are relatable to historical Bid, Ask, and Spread datum observations. Therefore, you can use prior value comparison, comparison to average, or, as illustrated in this example, z-score to standardize the method of anomaly detection. This is a simple example to illustrate the statistical mechanics of the congruence z-score data quality validation. I encourage you to develop your own congruence validation checks and relevant data quality tolerances using more sophisticated logic that may be more applicable and useful to identify data anomalies relative to the nature of the data.
Eleven datum values are within the valid tolerance; however, several data anomalies are identified using the congruence z-score data quality validation as defined in the DQS that do not meet the valid tolerance condition. This statistical approach to data validation for time series datum values is useful to detect anomalies or outliers. These datum values may or may not be valid, but since their respective z-scores are not within the expected valid tolerance, they require further inspection and review.
The model uses the cleansed master data volume, illustrated in Figure 4-11, to remediate the data anomalies.
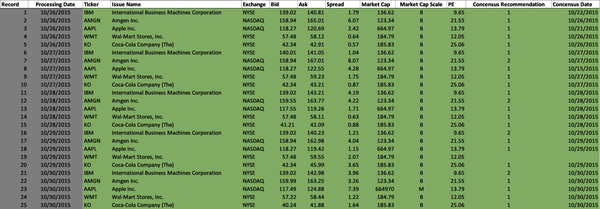
Figure 4-11. Cleansed security master data volume (large format, color version)
After the data anomalies are corrected, a summary of data quality metrics is illustrated in Figure 4-12. This shows the data quality status for the securities data volume has changed from IV (invalid) to V (valid). This example illustrates the data quality of the securities, fundamentals, and prices data in the master data volume meets the DQS for all downstream consumers. However, there are still additional data anomalies to be corrected.
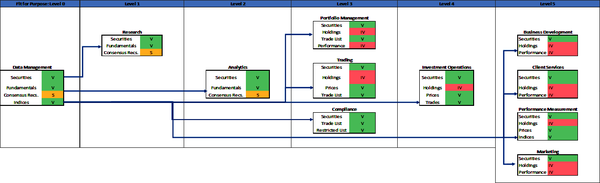
Figure 4-12. Data quality specification model (securities, fundamentals, prices) (large format, color version)
Collection DQS
As weâve discussed, a data collection is a discrete and distinct set of data, typically records of data, organized as a collection. All records must exist for a data collection to be a complete volume. The records in a data collection are a set of data elements (e.g., identifier, account, ticker, quantity, currency, weight). Indices, benchmarks, exchange-traded funds (ETF), and portfolio holdings are collections of data records that, respectively in aggregate, constitute data collections. The collection validation check entails validating all required data records exist for a specific point in time and are identifiable for a given collection (e.g., portfolio, index, ETF). There are many methods (from simple to sophisticated) that can be used to validate a data collection, including record counts, market value aggregation and comparison, and weights aggregation and comparison. As Iâve noted previously, you are encouraged to develop your own collection validation checks using additional tolerance ranges and more sophisticated logic that may be more applicable for the data you use.
Figure 4-13 represents five business days of cleansed Account, Account Name, Ticker, and Quantity data. This data volume also includes the validated Bid prices and the calculated Market Value for each portfolio holding. This data volume has already been validated using DQS and tolerances for completeness (relative to all the data elements), timeliness (for the Processing Date), conformity (for the Account, Account Name, and Ticker), and precision (for the Bid and Quantity). In addition, the portfolio collections (Voyager and Ping) have been validated for each day using collection DQS, confirming the historical portfolio holdings are complete and valid collections.
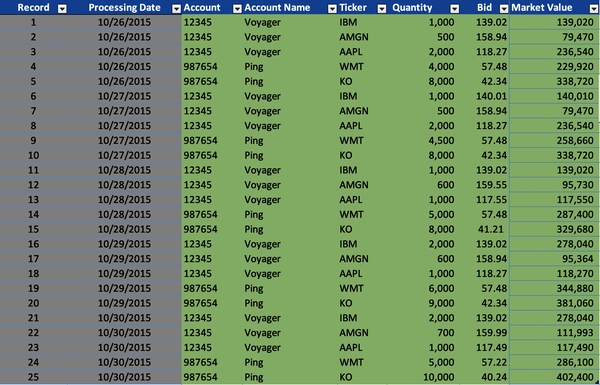
Figure 4-13. Historical portfolio holdings data volume (large format, color version)
The model uses the control values illustrated in Figure 4-14 to validate the number of records and the market value of the raw portfolio holdings data illustrated in Figure 4-15. The control values are provided by the accounting platform in a separate data file and are used to validate the raw portfolio holdings data.
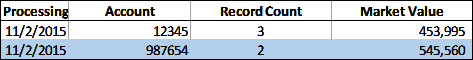
Figure 4-14. Portfolio holdings control data
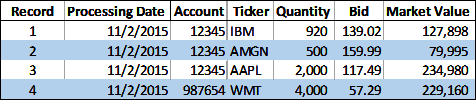
Figure 4-15. Raw portfolio holdings data
The model applies the collection DQS to the uncleansed, raw portfolio holdings data illustrated in Figure 4-15. The collection DQS are the same for each downstream business function and are defined for the portfolio holdings data in this model. Table 4-17 outlines the data quality tolerances for the portfolio holdings data volume. The model uses valid and invalid tolerances; however, you could add one or more suspect tolerances or other sophisticated logic if that is more appropriate for your data.
| Data volume | Data quality description | DQS | Business impact |
|---|---|---|---|
| Portfolio holdings | All portfolio holding records and data elements are mandatory and must exist. Use completeness DQS. The account and portfolio holdings must be identifiable using the Account and Ticker. Use cohesion DQS. The Record Count in the portfolio holdings control data must match the Record count in the raw portfolio holdings data volume to be valid; otherwise it is invalid, and the business impact is high. The percentage difference between the sum of the Market Values of the raw portfolio holdings data for an account must be less than 3% of the official Market Value of the portfolio in the portfolio holdings control data to be valid; otherwise, it is invalid, and the business impact is high. |
Portfolio holdings: Collectionârecord count = V, Raw Record Count = control Record Count, IV, Raw Record Count â control Record Count, H Portfolio holdings: Collectionâmarket value Percent Difference = V, Raw Market Value < 3% control Market Value, IV, Raw Market Value ⥠3% control Market Value, H |
High High |
The collection DQS for the portfolio holdings indicate all records and data elements are mandatory and must exist, and the account and portfolio holdings must be identifiable. The application of completeness DQS and cohesion DQS have been intentionally omitted for brevity. The collection DQS require that the raw portfolio holdings Record count for each account equal the corresponding portfolio holdings control Record Count. This means if the record counts match, then the collection is valid; otherwise, if the record counts do not match, then the collection is invalid. In addition, the DQS requir that the difference between the raw portfolio holdings Market Value for each account and the corresponding control Market Value be less than 3% to be valid; otherwise, the collection is invalid.
Figure 4-16 illustrates the results and shows the valid or invalid Record Count data quality metric for each collection. Figure 4-16 includes a copy of the Raw Record Count datum values in the column titled âRaw Record Count2,â for reference.
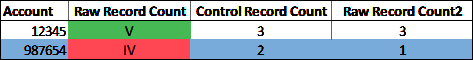
Figure 4-16. Collection record count data quality metrics (large format, color version)
Figure 4-17 illustrates the results and shows the valid or invalid Market Value data quality metric for each collection. Figure 4-17 includes a copy of the Raw Market Value datum values in the column titled âRaw Market Value2,â for reference. The difference between the raw Market Value and the control Market Value is expressed as a percentage for illustration purposes.
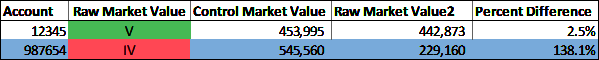
Figure 4-17. Collection market value percent difference data quality metrics (large format, color version)
Applying the DQS for the collection data dimension to the raw portfolio holdings data volume generates both statistics and data quality metrics. The statistics for the raw portfolio holdings data volume in Figures 4-16 and 4-17 are as follows:
4 datum records
2 data elements (Market Value and Record Count)
4 datum values
Table 4-18 shows the total number of valid and invalid datum values in the raw portfolio holdings data volume.
| Data element | Valid | Invalid |
|---|---|---|
| Record Count | 1 | 1 |
| Market Value | 1 | 1 |
| Metrics totals | 2 | 2 |
The collection data dimension is specific to the type of collection (e.g., portfolio holdings, ETF, index). A valid collection means all required records exist and are identifiable. A valid collection can contain invalid datum values, as long as the invalid datum is not required to validate the collection itself. Control totals, such as record counts and portfolio holdings market values, are useful to validate collections. However, if control totals are not available for use in the validation, then (as demonstrated with the market value tolerance), you can use a congruence prior value comparison or congruence z-score instead. The collection validation, like all other tolerance validations except accuracy, does not guarantee the data is valid and correct. Instead, as mentioned in Chapter 3, the collection validation check will identify anomalies.
Example
This is a simple example to illustrate the special nature of data collections and the mechanics of applying validation checks to confirm the validity of a collection. You are encouraged to develop your own collection validation checks and relevant data quality tolerances using more sophisticated logic that may be more applicable and useful to identify data anomalies relative to the nature of the data.
Letâs say two datum values are within the valid tolerance. However, two data anomalies are identified using the collection data quality validation defined in the DQS. These two anomalies do not meet the valid tolerance condition. Control totals (such as market value for portfolio holdings, weights and total weights for indices and ETFs, and general record counts) are useful for detecting anomalies or outliers. While the Market Value percent difference for account 12345 is 2.5% and within our DQS valid tolerance, we also know that on 11/2/2015, 80 shares of Apple stock was sold yielding a quantity of 920 shares. The sale is reflected in the raw portfolio holdings Market Value, which is $442,873. However, the sale has not been reflected in the portfolio holdings control data Market Value, which is $453,995. The record counts clearly indicate a portfolio holding record is missing for account 987654 and the percent difference between the raw Market Value and the control Market Value of 138.1% is an outlier. It is unclear what has happened to the portfolio holdings for account 987654. The portfolio holding record may have been mistakenly omitted, or the holding may have been completely sold but not recorded. Since both the Record Count and the Market Value data elements are not within the expected valid tolerance, they require further inspection and review.
Cohesion DQS
As mentioned in Chapter 3, the cohesion data dimension refers to the relationship between datum values that are typically organized as logical records of data. Generally, all datum values have a relationship to some other datum. This means the datum values must be organized and, at a minimum, paired with some form of identifier that links one datum or set of datum values to another and facilitates joining two or more datasets using the identifier. The identifier is often referred to as a primary key or foreign key. The identifier may be one datum value or may be a combination of datum values. In either case, the objective is to establish a precise relationship that enables you to join data together.
The security master data volume illustrated in Figure 4-18 contains the Processing Date and the Ticker. Together, these two data elements uniquely identify the data record for a specific date. The record contains the Issue Name, Exchange, Bid, Ask, Spread, and so on.
The cleansed and validated historical portfolio holdings data volume illustrated in Figure 4-18 contains the Processing Date and Account as primary data keys. Together, these two data elements uniquely identify the data record for a specific date. The record contains the Account Name, Ticker, Quantity, Bid, and Market Value. The Ticker data element in the holdings data volume, along with the Processing Date data element, are referred to as foreign data keys. These keys link to the Processing Date data element and Ticker data element that are part of the primary data key in the security master data volume. The cohesion data dimension for this data volume is valid if this relationship exists and the foreign-key-to-primary-key relationship is valid.
You will use the completeness, conformity, and if possible, accuracy DQS to validate the primary and foreign data key elements. You will use the timeliness DQS to validate the date, time, or date-time if the data volume is a time series. The primary and foreign data keys are mandatory to uniquely identify the datum records and to enable cohesion in cross-data volume linkages. Figure 4-18 illustrates the primary data key and foreign data key relationship between the security master data volume and the portfolio holdings data volume.
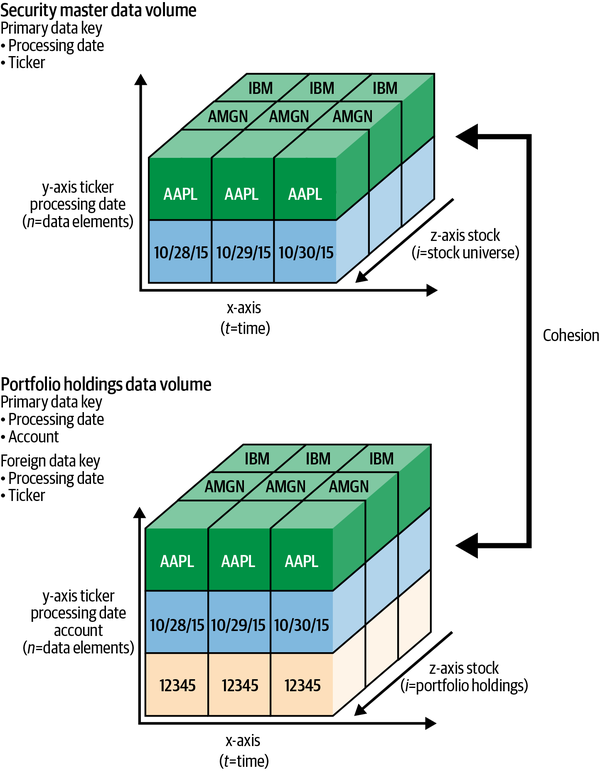
Figure 4-18. Cohesion security master and portfolio holdings
The model uses the raw portfolio holdings data illustrated in Figure 4-19.
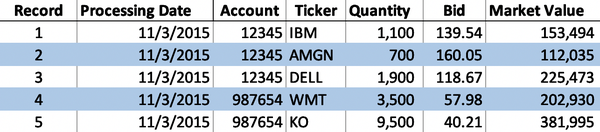
Figure 4-19. Unknown ticker raw portfolio holdings data volume
The Ticker is a mandatory field, as part of the foreign data key, to uniquely identify the portfolio holding record along with the Processing Date and Account. Applying the completeness, conformity, and accuracy DQS to the Ticker data element in the unknown ticker raw portfolio holdings data volume indicates all the Ticker datum values are valid. The model applies the cohesion DQS outlined in Table 4-19 to the unknown ticker raw portfolio holdings data volume. The cohesion DQS are the same for each downstream business function and are defined for the portfolio holdings data volume in this model. Table 4-19 outlines the data quality tolerances for the portfolio holdings data volume. The model assigns valid and invalid metrics by matching the foreign data key (Processing Date, Ticker) in the unknown ticker raw portfolio holdings data to the primary data key (Processing Date, Ticker) in the security master data volume.
| Data volume | Data quality description | DQS | Business impact |
|---|---|---|---|
| Portfolio holdings | All portfolio holding records and data elements are mandatory and must exist. Use completeness DQS. The portfolio holdings stock Ticker for a specific Processing Date must match and link to the same stock Ticker and Processing Date in the security master data volume to be valid; otherwise it is invalid, and the business impact is high. |
Portfolio holdings: Cohesion = V, raw holdings (Processing Date + Ticker) = security master (Processing Date + Ticker), IV, raw holdings (Processing Date + Ticker) â security master (Processing Date + Ticker), H | High |
When these primary and foreign data key relationships are well defined and enforced in physical data structures, such as databases, then the technology can enforce cohesion across data volumes using primary and foreign key relationships. However, the financial industry uses many diverse data volumes and technologies that have evolved over time. You may not be able to rely on the data management technology to enforce cohesion. Therefore, you may need to implement special cohesion data validations to ensure data volumes can be linked to one another.
The cohesion DQS for the raw portfolio holdings indicate the Processing Date and Ticker data elements are mandatory and must exist and the account and portfolio holdings must be identifiable. The Ticker and the Processing Date for each portfolio holding must match the Ticker and the Processing Date in the security master data volume. The application of completeness, conformity, accuracy, and cohesion DQS for the Account are valid and have been intentionally omitted for brevity. The cohesion DQS require the raw portfolio holdings Ticker and Processing Date match the Ticker and Processing Date for each portfolio holdings record in the security master data volume. This means if the foreign data key (Processing Date, Ticker) for each record in the raw portfolio holdings volume matches the primary data key (Processing Date, Ticker) in the security master data volume, then the cohesion of the data record is valid; otherwise, if the foreign data key and primary data key for each record do not match, then the cohesion of the data record is invalid.
Figure 4-20 illustrates the results and shows the valid or invalid portfolio holdings records using the Processing Date and Ticker data quality metrics. Figure 4-20 includes a copy of the Processing Date and Ticker datum values in columns titled âProcessing Date2â and âTicker2,â for reference.
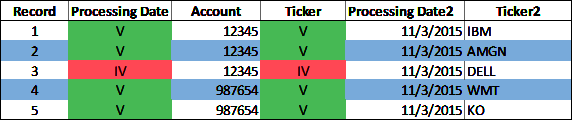
Figure 4-20. Cohesion data quality metrics (large format, color version)
The application of the DQS for the cohesion data dimension to the raw portfolio holdings data volume generates both statistics and data quality metrics. The statistics for the raw portfolio holdings data volume in Figure 4-20 are as follows:
5 datum records
2 data elements (Processing Date and Ticker)
10 datum values
Table 4-20 shows the total number of valid and invalid datum values in the raw portfolio holdings data volume.
| Data element | Valid | Invalid |
|---|---|---|
| Processing Date | 4 | 1 |
| Ticker | 4 | 1 |
| Metrics totals | 8 | 2 |
The cohesion data dimension reflects the ability of data volumes to be linked together. Cohesion between data volumes is specific to the nature of the data and the data elements, or combination of data elements, that constitute the primary data keys in one data volume and the foreign data keys in another data volume (e.g., Processing Date, Ticker). A volume of data with valid cohesion means the foreign data keys that identify records in one data volume match to the primary data keys that identify records in another data volume.
Any data volume can have valid cohesion and contain invalid datum values, as long as the invalid datum values are not those datum values required to validate the relationship to another data volume. The cohesion validation does not guarantee the data is valid and correct. Instead, as mentioned in Chapter 3, the validation check will identify anomalies.
Example
This is a simple example to illustrate the relationship, or cohesion, between data volumes and the mechanics of applying validation checks to confirm the validity of the relationship. I encourage you to develop your own cohesion validation checks and relevant data quality tolerances using more sophisticated logic that may be more applicable and useful to identify data anomalies relative to the nature of the data.
Four foreign data key values (Processing Date, Ticker) in the raw portfolio holdings are within the valid tolerance. However, one foreign data key anomaly is identified using the cohesion data quality validationâit does not meet the valid tolerance condition. The raw portfolio holdings data volume contains a record with processing date 11/3/2015 and ticker DELL, but this Ticker does not exist in the security master data volume. It is unclear why the DELL stock security for account 12345 is in the raw portfolio holdings volume when there is no record of the DELL stock security in the security master data volume. The portfolio holdings for account 12345 and the security master maintenance process both require further inspection and review.
A summary of the data quality metrics is illustrated in Figure 4-21 after the holdings data volume as well as the securities, fundamentals, consensus recommendations, and prices data volumes have been corrected. Figure 4-21 illustrates the data quality status for the holdings, securities, fundamentals, consensus recommendations, and prices data volumes have changed from IV (invalid) to V (valid) or S (suspect). The quality of these data volumes now meets the DQS for all downstream consumers.
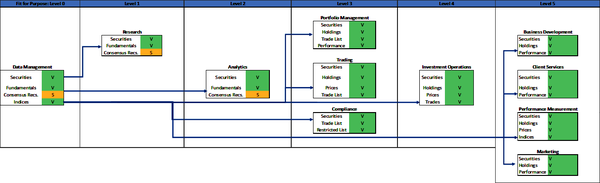
Figure 4-21. DQS model, including securities, fundamentals, consensus recommendations, prices, and holdings (large format, color version)
Fit for Purpose
Fit for purpose means the quality of the data volumes required by business functions, applications, and data consumers satisfies the DQS for the function, application, and consumer. The DQS for each data dimension presented in this example are generally the same for all business functions and consumers. However, this is generally not the case in the real world. Data quality and DQS are highly specific to the data requirements of the business function, application, and data consumer. It is possible the DQS for data dimensions for one business function can be different than the DQS for a different business function.
For example, researchers, data scientists, and data analysts who explore and test new datasets that have not been integrated into the production data management pipelines may have lower data quality tolerances than other, more critical data volumes used in production pipelines.
The model in Figure 4-21 illustrates six levels of fit-for-purpose. You will want to think about the data processes in your business function, and the various business functions in your firm, with the defined business impacts in mind. The delineation of different fit-for-purpose levels in this model is for illustration purposes; however, the business impact definitions are highly applicable to all data processes and business functions. You may have more or less fit-for-purpose levels based on different DQS, but there will almost always be some level of negative business impact from the use of poor-quality data (or, data that is not fit-for-purpose). Table 4-21 outlines the fit-for-purpose levels for the business functions in this model. It also indicates the required data quality level and business impact of poor-quality data for each business function.
| Fit-for-purpose level | Business function(s) | Required data quality level | Business impact |
|---|---|---|---|
| 0 | Data Management | Low | None |
| 1 | Research | Medium | Waste high-value resources, time |
| 2 | Analytics | Medium | Waste high-value resources, time Poor analytics |
| 3 | Portfolio Management, Trading, Compliance |
High | Damage at the financial, client regulatory, reputation levels |
| 4 | Investment Operations | High | Damage at the financial, client regulatory, reputation levels |
| 5 | Business Development, Client Services, Marketing, Performance Measurement | High | Damage at the financial, client regulatory, reputation levels |
Level 0 is the lowest fit-for-purpose level and represents the initial raw vendor data ingestion commonly managed by a data management, data stewardship, or enterprise data management function. At this level, the data is raw and uncleansed, and the function applies various DQS to the data to validate its quality relative to the DQS of the downstream consumers.
Levels 1 and 2 represent the fit-for-purpose levels based on DQS and acceptable data quality levels for the Research business function and the use of data volumes for generating internal analytics. The required data quality level is medium, which means the business function is operationally functional with lower quality data. However, the business impact is mediumâthe time of high-value resources is wasted and analytics may be inaccurate or of poor quality, but there is likely no financial, regulatory, or client impact. Medium-level business impact typically requires triage to identify the data anomalies and determine the remediation actions necessary to improve the data quality.
Levels 3, 4, and 5 represent the fit-for-purpose levels based on DQS and acceptable data quality levels for the Portfolio Management, Trading, Compliance, Investment Operations, Business Development, Client Services, Performance Measurement, and Marketing business functions. The required data quality level is high, which means the business function is in an operational failure state with lower quality data. The business impact of incomplete or inaccurate data can include financial penalties, loss of client trust, regulatory violations, and reputational damage. High-level business impact requires an immediate response to identify the data anomalies and determine the remediation actions necessary to improve the data quality.
Summary
The model and the examples used in this chapter are intentionally simple, as they are meant to demonstrate the mechanics and value of DQS in a firmâs data consumption pipeline. Data dimensions such as completeness, precision, and conformity can be viewed as having more general applicability to data. Completeness is applicable to all data of all data types. Conformity is applicable to any datum that must match a specific format, and precision is primarily applicable to numbers. The congruence dimension is typically used to validate time series numbers, but may also be used to validate time series of alpha and alphanumeric data. Congruence validations and tolerances are specific to the nature of the data. Timeliness validations are also specific to the nature of the data and are typically used to validate the date, time, or date-time of time series data volumes. Cohesion is specific to the relationship between data volumes and is thus specific to the nature of the data. Collection is a special dimension for data volumes that must contain all member data components to be valid collections. Finally, accuracy is specific and often unique to the data under inspection.
The application of DQS to each of these data dimensions, from general to specific, is illustrated in Table 4-22.
| DQS application | Dimension |
|---|---|
| Specific | Accuracy |
|
|
Collection Cohesion Congruence Timeliness Conformity Precision |
| General | Completeness |
Congratulations! You now know a lot more about data dimensions and the tools needed to quantitatively measure the shape of your data using defined valid, suspect, and invalid tolerances in DQS. The application and use of the DQS framework generates large volumes of data quality metrics. The next chapter introduces data quality visualizations that you can use to map and chart your analytics. The purpose of these visualizations is to enable you to quickly understand the spectrum and density of valid, suspect, and invalid data in your data volumes. You should be particularly interested in the suspect and invalid data that do not satisfy the fit-for-purpose DQS of consumers and that require further inspection, investigation, and likely remediation.
Get Data Quality Engineering in Financial Services now with the O’Reilly learning platform.
O’Reilly members experience books, live events, courses curated by job role, and more from O’Reilly and nearly 200 top publishers.

