3.2. Using Monitoring Tools
To effectively diagnose a problem in one of the four critical resources (processor, memory, disk, and network), you need to monitor what is going on with your system. In the following sections, you look at two tools that you can use to diagnose problems in these resource areas.
3.2.1. Task Manager
Task Manager (or taskman.exe) is a nice, quick, and simple tool. It is not as full-featured as Performance Monitor (see the following section), but what it lacks in features, it makes up for in simplicity and speed. To open Task Manager, press Ctrl+Alt+Del and click the Task Manager button in the Security dialog box. In Windows XP Home, just pressing Ctrl+Alt+Del opens Task Manager. You can also open Task Manager by right-clicking an empty area of the Taskbar and choosing Task Manager from the contextual menu.
3.2.1.1. Performance tab
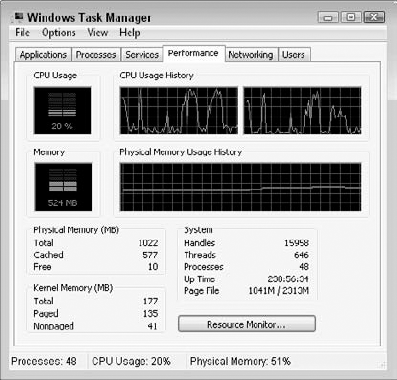
You can use Task Manager to diagnose processor, memory, network (with Windows XP), and service (with Windows Vista) bottlenecks. Figure 3-1 shows the Performance tab of Task Manager, which is typically the tab you will use first to identify a problem.
Figure 3.1. The Performance tab of Task Manager is usually the first place to look for problems.

On the Performance tab, you can find critical data about your system's performance. This tab is broken down into two main sections: the graphs and the numeric data. In the graph section ...
Get CompTIA A+® Certification All-In-One For Dummies®, 2nd Edition now with the O’Reilly learning platform.
O’Reilly members experience books, live events, courses curated by job role, and more from O’Reilly and nearly 200 top publishers.

