Chapter 10. Additional Examples
By now you have learned about color theory, color psychology, and how to avoid common pitfalls when working with colors in data visualizations and data stories. In this chapter, we’ll tell some stories with data and demonstrate how color can help our audience understand the key insights. Let’s go ahead and start our journey of data storytelling. We will review some different scenarios that will help you apply some of the concepts we’ve covered in the book.
Using Colors Found in Nature
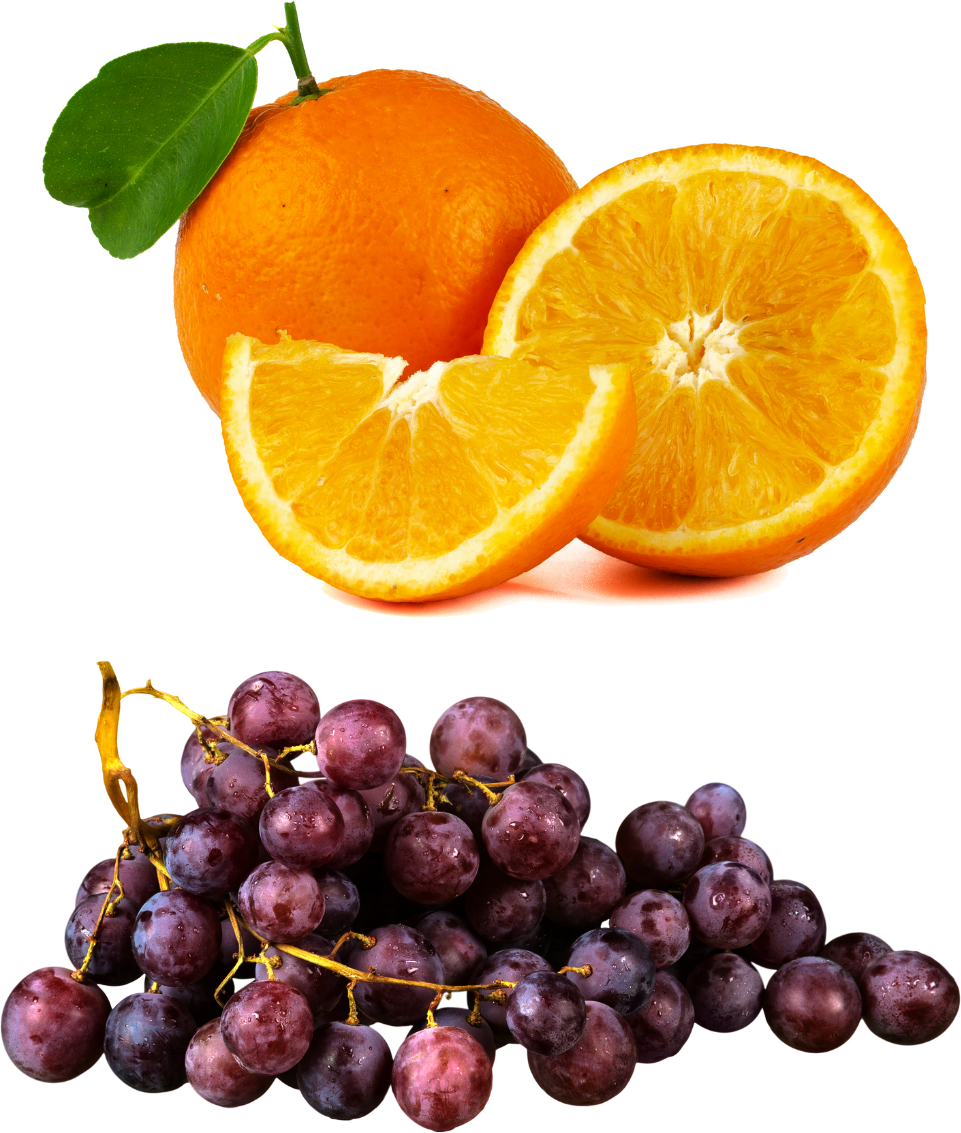
What should we add to our salad menu? Let’s imagine that we are working for a global restaurant chain that is focused on making salads. Those in charge of maintaining the restaurant menu asked you to find out which of these two ingredients they should add to their menu as a salad topping: oranges or grapes (Figure 10-1).

Figure 10-1. An orange and some purple grapes
To answer this question, we gathered data from Google Trends—exploring and comparing the popularity of the search terms orange and grape.
Google Trends provides access to a largely unfiltered sample of actual search requests made to Google. It’s anonymized (no one is personally identified), categorized (determining the topic for a search query), and aggregated (grouped together).
The data set provides us with a breakdown by region to demonstrate where these terms were searched for more frequently between ...
Get ColorWise now with the O’Reilly learning platform.
O’Reilly members experience books, live events, courses curated by job role, and more from O’Reilly and nearly 200 top publishers.

