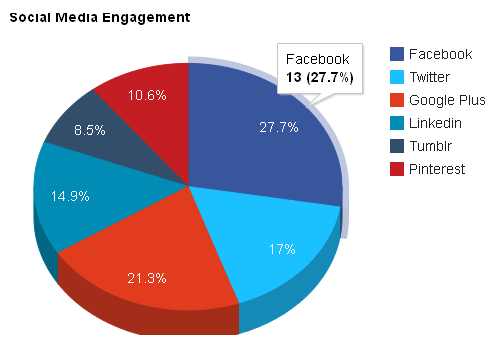
Pie charts show the components of the whole. Companies that work with both traditional and big data may use this technique to look at customer segments or market shares. The difference lies in the sources from which these companies take raw data for the analysis.
The following is an example of a pie chart: