29.2. Statechart Diagrams
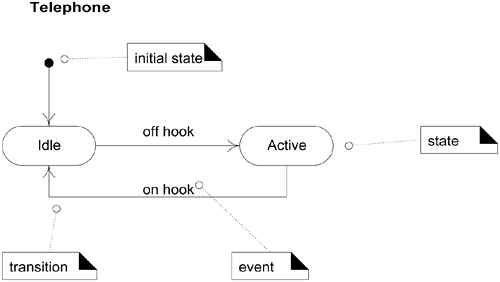
A UML statechart diagram, as shown in Figure 29.1, illustrates the interesting events and states of an object, and the behavior of an object in reaction to an event. Transitions are shown as arrows, labeled with their event. States are shown in rounded rectangles. It is common to include an initial pseudo-state, which automatically transitions to another state when the instance is created.
Figure 29.1. Statechart diagram for a telephone.

A statechart diagram shows the lifecycle of an object: what events it experiences, its transitions, and the states it is in between these events. It need not illustrate every possible ...
Get Applying UML and Patterns: An Introduction to Object-Oriented Analysis and Design and the Unified Process, Second Edition now with the O’Reilly learning platform.
O’Reilly members experience books, live events, courses curated by job role, and more from O’Reilly and nearly 200 top publishers.

